Howdy, Stranger!
We are about to switch to a new forum software. Until then we have removed the registration on this forum.
-
max value in an Array
There is an example that you could explore using hashMaps here: https://forum.processing.org/two/discussion/26371/how-to-create-a-heatmap-from-list-of-x-y-points
You don't have to use this but you could explore it and see if it could fit your project.
which there is a max value about every 100seconds or 100 values..Is there a way to find how many max values appear in 1 minute for example.How many times do i have a beat or a pulse(max value) in one minute
You need to design this part. It is hard to do this part as we don't own your project and we don't know anything about your design. For example, checking the max every 100 seconds or 100 points are two different things, unless if you are collecting 1 pt every seconds, so doing it either way should be the same. However, we do not know the sampling rate of your data, the size of your data, the format of your data, the structure of your table, and how everything fits together. Remember, every time we come back to a post, we forget the details about the post. This is my approach. Unfortunately I cannot go back and read the previous comments to figure out if something has change in your project. The best thing you can do is to provide a question with all the needed details and as concise as possible.
Also it is important to provide a sample data set. This way everybody should aim to get the same result and removes a level of complexity.
Kf
Trying to generate heatmap off of an array of float values. Getting an index out of bounds error...Edit: Okay I was messing around with initializing "list", and I put
String[] list = new String[64]Then to test it I had it print out the length of list
println(list.length);And it prints 1 for the first hundred lines or so then it changes to 24?? Not sure why that is happening...
So my processing code below receives 64 float values from the arduino code. The processing uses linear interpolation equations blah blah to calculate colors for the heat map it generates (I've tested it, it works with a predefined array). What I'm trying to do is fill my 8x8 array from the serial port (the 64 values being sent), but when I run it I get the error on line 45
ArrayIndexOutOfBoundsException: 1But it used to come out as 5, not sure why it changed to 1. I don't know why this happens, Any help would be great, Thanks!
Arduino:
#include <Wire.h>
#include <Adafruit_AMG88xx.h>

Adafruit_AMG88xx amg;

float pixels[AMG88xx_PIXEL_ARRAY_SIZE];

float maxt = 80.00;
float mint = 0.00;
float newmax = 8.00;
float newmin = 0.00;
float a = (newmax - newmin) / (maxt - mint);

void setup() {
  Serial.begin(9600);

  bool status;

  // default settings
  status = amg.begin();
  if (!status) {
    Serial.println("Could not find a valid AMG88xx sensor, check wiring!");
    while (1);
  }


  delay(100); // let sensor boot up
}


void loop() {
  //read all the pixels
  amg.readPixels(pixels);


  for (int i = 1; i <= AMG88xx_PIXEL_ARRAY_SIZE; i++) {
    Serial.print(pixels[i - 1] / 10.0, 3);
    Serial.print(',');
  }
  Serial.println();
  //delay a second
  delay(100);
}
Processing:
import processing.serial.*; Serial myPort; String myString; String[] list; int m = 0; int r = 8; // number of rows in input array int c = 8; // number of columns in input array int t = 300; // parameter (array resize factor) int rows = (r-1)*t; // height of the heat map int cols = (c-1)*t; // width of the heat map float[][] array = new float[r][c]; // input array float[][] interp_array = new float[rows][cols]; // interpolated array void settings() { size(cols, rows); } void setup() { printArray(Serial.list()); //open port you are using at the rate you want myPort = new Serial(this, Serial.list()[0], 9600); myPort.write(65); noStroke(); } void draw() { while (myPort.available() > 0 ) { //Expand array size to the number of bytes you expect byte[] inBuffer = new byte[1024]; myPort.readBytesUntil('\n', inBuffer); if (inBuffer != null) { myString = new String(inBuffer); list = split(myString, ','); for (int i = 0; i < r; i++) { for (int j = 0; j < c; j++) { array[i][j] = float(list[m]); m++; } } m=0; } } bilinearInterpolation(); //these are IN the while loop applyColor(); } void bilinearInterpolation() { // Bi-linear Interpolation algorithm for (int i=0; i<r; i++) { for (int j=0; j<c; j++) { int x = j*t - 1; int y = i*t - 1; if (x<0) x=0; if (y<0) y=0; interp_array[y][x] = array[i][j]; } } for (int y=0; y<rows; y++) { int dy1 = floor(y/(t*1.0)); int dy2 = ceil(y/(t*1.0)); int y1 = dy1*t - 1; int y2 = dy2*t - 1; if (y1<0) y1 = 0; if (y2<0) y2 = 0; for (int x=0; x<cols; x++) { int dx1 = floor(x/(t*1.0)); int dx2 = ceil(x/(t*1.0)); int x1 = dx1*t - 1; int x2 = dx2*t - 1; if (x1<0) x1 = 0; if (x2<0) x2 = 0; float q11 = array[dy1][dx1]; float q12 = array[dy2][dx1]; float q21 = array[dy1][dx2]; float q22 = array[dy2][dx2]; int count = 0; if (q11>0) count++; if (q12>0) count++; if (q21>0) count++; if (q22>0) count++; if (count>2) { if (!(y1==y2 && x1==x2)) { float t1 = (x-x1); float t2 = (x2-x); float t3 = (y-y1); float t4 = (y2-y); float t5 = (x2-x1); float t6 = (y2-y1); if (y1==y2) { interp_array[y][x] = q11*t2/t5 + q21*t1/t5; } else if (x1==x2) { interp_array[y][x] = q11*t4/t6 + q12*t3/t6; } else { float diff = t5*t6; interp_array[y][x] = (q11*t2*t4 + q21*t1*t4 + q12*t2*t3 + q22*t1*t3)/diff; } } else { interp_array[y][x] = q11; } } else { interp_array[y][x] = 0; } } } } void applyColor() { // Generate the heat map color c1 = color(0, 0, 255); // Blue color color c2 = color(0, 255, 0); // Green color color c3 = color(255, 0, 0); // Red color color c4 = color(255, 255, 0); // Yellow color for (int i = 0; i < rows; i++) { for (int j = 0; j < cols; j++) { float value = interp_array[i][j]; color c; float fraction; if (value>=1 && value<2) { fraction = (value-1)/1.0; c = lerpColor(c1, c2, fraction); } else if (value>=2 && value<3) { fraction = (value-2)/1.0; c = lerpColor(c2, c3, fraction); } else if (value>=3 && value<5) { fraction = (value-3)/2.0; c = lerpColor(c3, c4, fraction); } else c = c4; stroke(c); point(j, i); } } }[job - paid] Short program for data presentationThis is the same problem as in the discussion posted by alivewire.
In fact alivewire and Zomballo have the same IP address. ;))
Complicated Heatmap - data presentationI didn't have time to finish this (your data set is not right for this)
but based on kfrajers code I calculated for each point where he looks at and tried to bring this into an hashmap
//HeatMap demonstration using a hash map //REFERENCE: https : // forum.processing.org/two/discussion/26371/how-to-create-a-heatmap-from-list-of-x-y-points#latest // https : // forum.processing.org/two/discussion/26377/complicated-heatmap-data-presentation#latest //By Kf @ 15-Feb-2018 //INSTRUCTIONS: // *-- <a href="/two/profile/Input">@Input</a> a data set that is made of PVector values (Like an ArrayList container // *-- Do this by using something similar to addOrUpdate() provided below // *-- // *-- The software will generate a heat map: // *-- // *-- The code will compute the data's max and min values from the x and y input values // *-- Then it populates a hashTable defined by coordinates(key) and frequency(value) // *-- The key, which is a PVector) is mapped against the sketch's width and height // *-- The value is mapped between min and max color //=========================================================================== // IMPORTS: import java.util.Comparator; import java.util.Map; import java.util.Collections; //=========================================================================== // FINAL FIELDS: final color MINCOL=color(255, 10, 10); final color MAXCOL=color(10, 10, 255); //=========================================================================== // GLOBAL VARIABLES: ArrayList<PosWithYaw> data; HashMap<PVector, Integer> table; int current=0; float[] range; float minInt; float maxInt; //=========================================================================== // PROCESSING DEFAULT FUNCTIONS: void settings() { size(600, 600); } void setup() { // noLoop(); textAlign(CENTER, CENTER); rectMode(RADIUS); noStroke(); //INIT data set data=new ArrayList<PosWithYaw>(); String[] loadedFile=loadStrings("data1.txt"); println (loadedFile.length +" lines found.\n"); for (int i=0; i<loadedFile.length; i++) { String[] line = split(loadedFile[i], " "); if (line.length==3) { data.add(new PosWithYaw( float(line[0])*1+100, float(line[1])*1+100, float(line[2]) )); }//if }//for for (PosWithYaw pwy : data) { pwy.printMe(); pwy.getResultingPos(); } println("\n\n"); table=new HashMap<PVector, Integer>(); //TESTING //============================================ //PVector PVEC=new PVector(50, 50); //addOrUpdate(PVEC); //addOrUpdate(new PVector(1, 0)); //addOrUpdate(PVEC); //addOrUpdate(PVEC); //println(table.get(PVEC)); //for (Map.Entry me : table.entrySet()) { // print(me.getKey() + " is "); // println(me.getValue()); //} //============================================ //FIND min and max of X and Y components of input data set range=getRange(data); //FEED data to hashMap for (PosWithYaw v : data) { addOrUpdate(v); } ////NEXT prints content of hashMap //for (Map.Entry me : table.entrySet()) { // print(me.getKey() + " is "); // println(me.getValue()); //} minInt=Collections.min(table.values()); maxInt=Collections.max(table.values()); println("Repport ranges:"); println(range); println("Report min and max intensities = ", minInt, maxInt); background(0); //for (Map.Entry me : table.entrySet()) { // PVector coord=(PVector)me.getKey(); // Integer val=(Integer)me.getValue(); // float px=map(coord.pos.x, range[0], range[1], 0, width); // float py=map(coord.pos.y, range[2], range[3], height, 0); // color c=lerpColor(MINCOL, MAXCOL, map(val, minInt, maxInt, 0, 1)); // fill(c); // println(px, py, val); // //rect(px, py, width/(1.0*range[1]-range[0]), height/(1.0*range[3]-range[2])); // ellipse(px, py, width/(1.0*range[1]-range[0]), height/(1.0*range[3]-range[2])); //} } void draw() { noLoop(); background(0); fill(255, 0, 0); stroke(255, 0, 0); // loop over all items: for (PosWithYaw v : data) { // v.display(); // We can access values by their key int val = (Integer)table.get(v.resultingPos); float px=map(v.resultingPos.x, range[0], range[1], 30, width-30); float py=map(v.resultingPos.y, range[2], range[3], height-30, 30); color c=lerpColor(MINCOL, MAXCOL, map(val, minInt, maxInt, 0, 1)); fill(c); println(px, py, val); //rect(px, py, width/(1.0*range[1]-range[0]), height/(1.0*range[3]-range[2])); noStroke(); ellipse(px, py, 14, 14); } } //=========================================================================== // OTHER FUNCTIONS: void addOrUpdate(PosWithYaw pi) { if (table.containsKey(pi.resultingPos)) println("Found"); table.put(pi.resultingPos, table.containsKey(pi.resultingPos) ? table.get(pi.resultingPos)+1 : 1); } float[] getRange(ArrayList<PosWithYaw> in) { float minx=PApplet.MAX_INT; float maxx=PApplet.MIN_INT; float miny=PApplet.MAX_INT; float maxy=PApplet.MIN_INT; for (PosWithYaw pp : in) { if (pp.resultingPos.x<minx) minx=pp.resultingPos.x; if (pp.resultingPos.y<miny) miny=pp.resultingPos.y; if (pp.resultingPos.x>maxx) maxx=pp.resultingPos.x; if (pp.resultingPos.y>maxy) maxy=pp.resultingPos.y; } float[] r = {minx, maxx, miny, maxy}; return r; } // =============================================================== class PosWithYaw { PVector pos; float yaw; PVector resultingPos; // constr PosWithYaw( float x_, float y_, float yaw_ ) { pos = new PVector(x_, y_); yaw=yaw_; }// constr void printMe() { println (pos.x +"\t, " +pos.y +" looks at " + yaw); }//method void getResultingPos() { // pos of the objects we look at float newX = pos.x + cos (radians(yaw)) * 60; float newY = pos.y + sin (radians(yaw)) * 60; resultingPos = new PVector( round(newX), round(newY) ); } void display() { fill(255, 0, 0); text(yaw, pos.x, pos.y-13); ellipse (pos.x, pos.y, 8, 8); line(pos.x, pos.y, resultingPos.x, resultingPos.y); }//method void displayOld() { ellipse (pos.x, pos.y, 8, 8); text(yaw, pos.x, pos.y-13); pushMatrix(); translate(pos.x, pos.y); rotate(radians(yaw)); line(0, 0, 60, 0); popMatrix(); }//method // }//class //Complicated Heatmap - data presentationthat other thread (now closed): https://forum.processing.org/two/discussion/26371/how-to-create-a-heatmap-from-list-of-x-y-points
Complicated Heatmap - data presentationSorry guys I thouth it would be beter to start new thread becuase this is more complicated than idea presentent before. Apoligize for my mistake.
Chrisir:
Your table above looks like x,y,YAW, there are 3 columns -> Yes
Do you want the heatmap to be seen from above or from the side? -> from above would be better
But in which way do you want to appear the yaw? Like 60 centimeters before his eyes in the right direction ? -> I think 60 centimeters would be good.
How to create a heatmap from list of X Y Pointspointlessly continued here: https://forum.processing.org/two/discussion/26377/complicated-heatmap-data-presentation
Complicated Heatmap - data presentationNot good to start a new thread on this
Your table above looks like x,y,YAW, there are 3 columns
Do you want the heatmap to be seen from above or from the side?
Probably the first
But in which way do you want to appear the yaw? Like 60 centimeters before his eyes in the right direction ?
Complicated Heatmap - data presentationHi, I'v recently post about problem with drawing heatmaps, but I figured out that I have to present more information on two images. So I have data from user who was using Oculus. I have his position on floor (X, Y for every second of research) and i have his head Yaw rotation (also saved for every second of research ). I have to present this data with heatmaps - showing where he was standing most of time and where he was looking for the most of time
How to create a heatmap from list of X Y PointsHave you explore prev posts? https://forum.processing.org/two/search?Search=heatmap
A demonstration below.
Kf
//HeatMap demonstration using a hash map //REFERENCE: https://forum.processing.org/two/discussion/26371/how-to-create-a-heatmap-from-list-of-x-y-points#latest //By Kf @ 15-Feb-2018 //INSTRUCTIONS: // *-- @Input a data set that is made of PVector values (Like an ArrayList container // *-- Do this by using something similar to addOrUpdate() provided below // *-- // *-- The software will generate a heat map: // *-- // *-- The code will compute the data's max and min values from the x and y input values // *-- Then it populates a hashTable defined by coordinates(key) and frequency(value) // *-- The key, which is a PVector) is mapped against the sketch's width and height // *-- The value is mapped between min and max color //=========================================================================== // IMPORTS: import java.util.Comparator; import java.util.Map; import java.util.Collections; //=========================================================================== // FINAL FIELDS: final color MINCOL=color(255, 10, 10); final color MAXCOL=color(10, 10, 255); //=========================================================================== // GLOBAL VARIABLES: ArrayList<PVector> data; HashMap<PVector, Integer> table; //=========================================================================== // PROCESSING DEFAULT FUNCTIONS: void settings() { size(600, 600); } void setup() { noLoop(); textAlign(CENTER, CENTER); rectMode(RADIUS); noStroke(); //INIT data set data=new ArrayList<PVector>(); for (int i=0; i<100000; i++) { data.add(new PVector(floor(random(5, 55)), floor(random(0, 30)))); } table=new HashMap<PVector, Integer>(); //TESTING //============================================ //PVector PVEC=new PVector(50, 50); //addOrUpdate(PVEC); //addOrUpdate(new PVector(1, 0)); //addOrUpdate(PVEC); //addOrUpdate(PVEC); //println(table.get(PVEC)); //for (Map.Entry me : table.entrySet()) { // print(me.getKey() + " is "); // println(me.getValue()); //} //============================================ //FIND min and max of X and Y components of input data set float[] range=getRange(data); //FEED data to hashMap for (PVector v : data) { addOrUpdate(v); } ////NEXT prints content of hashMap //for (Map.Entry me : table.entrySet()) { // print(me.getKey() + " is "); // println(me.getValue()); //} float minInt=Collections.min(table.values()); float maxInt=Collections.max(table.values()); println("Repport ranges:"); println(range); println("Report min and max intensities = ",minInt, maxInt); background(0); for (Map.Entry me : table.entrySet()) { PVector coord=(PVector)me.getKey(); Integer val=(Integer)me.getValue(); float px=map(coord.x, range[0], range[1], 0, width); float py=map(coord.y, range[2], range[3], height, 0); color c=lerpColor(MINCOL, MAXCOL, map(val, minInt, maxInt, 0, 1)); fill(c); println(px, py, val); rect(px, py, width/(1.0*range[1]-range[0]), height/(1.0*range[3]-range[2])); } } //=========================================================================== // OTHER FUNCTIONS: void addOrUpdate(PVector pi) { table.put(pi, table.containsKey(pi) ? table.get(pi)+1 : 1); } float[] getRange(ArrayList<PVector> in) { float minx=PApplet.MAX_INT; float maxx=PApplet.MIN_INT; float miny=PApplet.MAX_INT; float maxy=PApplet.MIN_INT; for (PVector pp : in) { if (pp.x<minx) minx=pp.x; if (pp.y<miny) miny=pp.y; if (pp.x>maxx) maxx=pp.x; if (pp.y>maxy) maxy=pp.y; } float[] r = {minx, maxx, miny, maxy}; return r; }How to create a heatmap from list of X Y PointsHello everyone,
I need to use processing to visualise some data from my school research. I have data of X Y position of user.For exemple:
-44 -23
-42 -22
-43 -24
-51 -30
-59 -36
-63 -39
-64 -39
-63 -38
-63 -38
-63 -38
-63 -38
-63 -38
-63 -38
-63 -38
-63 -37
-63 -36
-63 -35
I have to create a heatmap showing this array.
Some example of heatmap that I need:

Can anyone help me please? It is very important to me:(
List-based interpolationsI've been thinking about array-based interpolations recently.
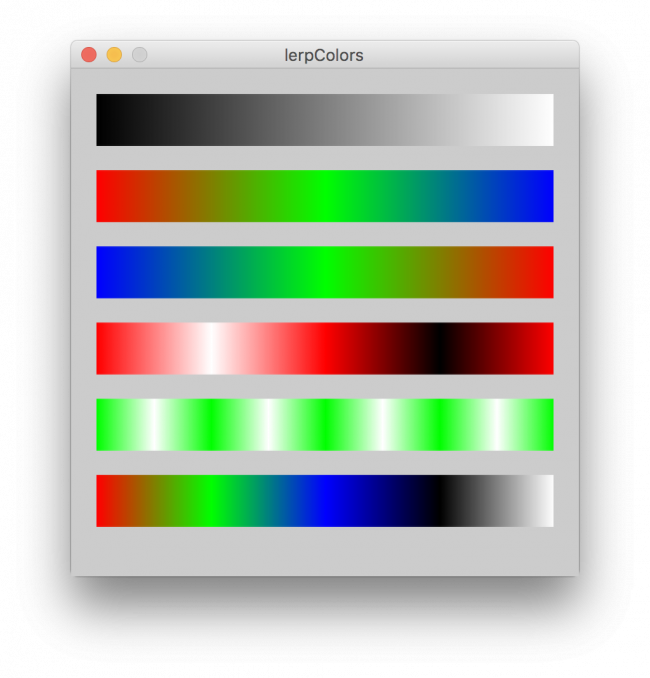
One that often comes up is how to interpolate not just between two colors, but across an arbitrarily long list of three or more colors, e.g. a heatmap scale blue-white-red:
color lerpColors(float amt, color... colors) {
  if(colors.length==1){ return colors[0]; }
  float unit = 1.0/(colors.length-1);
  return lerpColor(colors[floor(amt / unit)], colors[ceil(amt / unit)], amt%unit/unit);
}
Another that I see is complex path navigation: how to interpolate not just between two PVectors, but along an arbitrarily long list of three or more points, e.g. a sprite patrolling path:
PVector lerpVectors(float amt, PVector... vecs) {
  if(vecs.length==1){ return vecs[0]; }
  float unit = 1.0/(vecs.length-1);
  return PVector.lerp(vecs[floor(amt / unit)], vecs[ceil(amt / unit)], amt%unit/unit);
}
Of course, this can be done when interpolating multiple floats as well:
float lerps( float amt, float... vals) {
  if(vals.length==1){ return vals[0]; }
  float unit = 1.0/(vals.length-1);
  return lerp(vals[floor(amt / unit)], vals[ceil(amt / unit)], amt%unit/unit);
}
These could also be implemented for ArrayLists rather than arrays.
This problem seems fairly fundamental to the idea of interpolation, and comes up a lot. I wonder if it would be worth putting together a pull request to simply add an extra signature to lerp(), lerpColor(), and PVector.lerp().
A downside of I can see for applications of this method is that there is no distance scaling -- so it wouldn't work if for example you wanted a constant increase in amt to navigate the path or move through colorspace at a constant speed, but your points were not a constant distance apart.
Alternately, I wonder if there are better approaches to this class of problems.
Any suggestions or feedback?
Color examples
Vector example

/** * LerpVectorsExample -- interpolates any list of vectors rather than just two * Jeremy Douglass 2017-11-30 Processing 3.3.6 **/ PVector vecs[]; void setup() { size(200, 200); stroke(255,0,0); newPath(5); stroke(0); fill(0,0,255); } void draw() { background(255); // new path if(frameCount%180==0){ newPath(5); } // draw the path drawPath(vecs); // draw a circle along the path PVector loc = lerpVectors(map(mouseX, 0, width, 0, 1.0), vecs); ellipse(loc.x, loc.y, 50,50); } void newPath( int count){ vecs = new PVector[count]; for(int i=0; i<count; i++){ vecs[i] = new PVector(random(width), random(height)); } } void drawPath(PVector... vecs) { for (int i=1; i<vecs.length; i++) { line(vecs[i].x, vecs[i].y, vecs[i-1].x, vecs[i-1].y); } } PVector lerpVectors(float amt, PVector... vecs) { if(vecs.length==1){ return vecs[0]; } float cunit = 1.0/(vecs.length-1); return PVector.lerp(vecs[floor(amt / cunit)], vecs[ceil(amt / cunit)], amt%cunit/cunit); }why is my text() under line()Hey :)
I use peasycam to rotate my sphere, and cam.beginHUD() to display some information on the screen. ** in line 120-130 I create 3 lines in line 219-233 I create 3 texts which should be on this lines - but they are UNDER the lines**
why?
int ptsW, ptsH; import peasy.*; PeasyCam cam; PImage img; int numPointsW; int numPointsH_2pi; int numPointsH; float[] coorX; float[] coorY; float[] coorZ; float[] multXZ; PImage heatmap; PImage cancer; PImage suicide; PImage traffic; PImage currentIcon; float currentCancer = 0; float currentTraffic = 0; float currentSuicide = 0; int imagestate; int alphavalue = 255; int cancerTrigger; int trafficTrigger; int suicideTrigger; void setup() { fullScreen(P3D); cam = new PeasyCam(this, 100); cam.setMinimumDistance(10); cam.setMaximumDistance(100); background(0); noStroke(); img=loadImage("Heatmap_Cancer_traffic_Suicide_02.png"); ptsW=30; ptsH=30; // Parameters below are the number of vertices around the width and height initializeSphere(ptsW, ptsH); heatmap = loadImage("Heatmap_Cancer_traffic_Suicide_02.png"); cancer = loadImage("Cancer_01.png"); suicide = loadImage("Suicide_01.png"); traffic = loadImage("Traffic_01.png"); heatmap.loadPixels(); currentIcon = traffic; // nur für den Anfang, damit es nicht nichts ist. } // Use arrow keys to change detail settings void keyPressed() { if (keyCode == ENTER) saveFrame(); if (keyCode == UP) ptsH++; if (keyCode == DOWN) ptsH--; if (keyCode == LEFT) ptsW--; if (keyCode == RIGHT) ptsW++; if (ptsW == 0) ptsW = 1; if (ptsH == 0) ptsH = 2; // Parameters below are the number of vertices around the width and height initializeSphere(ptsW, ptsH); } void draw() { background(0); pushMatrix(); rotateX(-.5); rotateY(-.5); textureSphere(400, 400, 400, img); popMatrix(); cam.beginHUD(); fill(0,120); noStroke(); rect(0,0,width,height/2-1); rect(0,height/2+10,width,height); pushMatrix(); currentCancer = red(get(width/2, height/2)); currentTraffic = blue(get(width/2, height/2)); currentSuicide = green(get(width/2, height/2)); // image (heatmap, 0,0, width, height); // debug if (keyPressed) { if (key == 's') { currentSuicide = 150; } if (key == 't') { currentTraffic = 150; } if (key == 'c') { currentCancer = 150; } } cancerTrigger = 0; trafficTrigger = 0; suicideTrigger = 0; //Diagram - tode / 100.000 stroke(255); strokeWeight(36); fill(255); translate(width/2, height/2); line(75, 0, 75+currentCancer, 0); rotate(PI*2/3); line(75, 0, 75+currentTraffic, 0); rotate(PI*2/3); line(75, 0, 75+currentSuicide, 0); popMatrix() ; //Punkte - "live DeathCounter" pushMatrix() ; translate(width/2, height/2); cancer.resize(70, 70); suicide.resize(70, 70); traffic.resize(70, 70); strokeWeight(1); fill(255); if (frameCount % (170-currentCancer) == 0) { if (random(255) < currentCancer) { cancerTrigger = 1; } } if (frameCount % (170-currentTraffic) == 0) { if (random(255) < currentTraffic) { trafficTrigger = 1; } } if (frameCount % (170-currentSuicide) == 0) { if (random(255) < currentSuicide) { suicideTrigger = 1; } } //ICONS if (cancerTrigger == 1) { currentIcon = cancer; imagestate=1; alphavalue = 255; } if (trafficTrigger == 1) { currentIcon = traffic; imagestate=1; alphavalue = 255; } if (suicideTrigger == 1) { currentIcon = suicide; imagestate=1; alphavalue = 255; } // QUADS if (cancerTrigger == 1) { quad(0, 35, 0, -35, 75, -18, 75, 18); imagestate=1; alphavalue = 255; } rotate(PI*2/3); if (trafficTrigger == 1) { quad(0, 35, 0, -35, 75, -18, 75, 18); imagestate=1; alphavalue = 255; } rotate(PI*2/3); if (suicideTrigger == 1) { quad(0, 35, 0, -35, 75, -18, 75, 18); imagestate=1; alphavalue = 255; } //FADING if (imagestate==1) { if (frameCount % 2 == 0) { alphavalue -= 5; if (alphavalue < 10) { imagestate = 0; } } } tint(255, alphavalue); image(currentIcon, -35, -35); tint (255, 255); // Text auf dem Diagram fill(0); rotate(PI*2/3); textSize(32); text(round(currentCancer), 65, 10); rotate(PI*2/3); textSize(32); text(round(currentTraffic), 65, 10); rotate(PI*2/3); textSize(32); text(round(currentSuicide), 65, 10); rotate(PI*2/3); popMatrix(); cam.endHUD(); } void initializeSphere(int numPtsW, int numPtsH_2pi) { // The number of points around the width and height numPointsW=numPtsW+1; numPointsH_2pi=numPtsH_2pi; // How many actual pts around the sphere (not just from top to bottom) numPointsH=ceil((float)numPointsH_2pi/2)+1; // How many pts from top to bottom (abs(....) b/c of the possibility of an odd numPointsH_2pi) coorX=new float[numPointsW]; // All the x-coor in a horizontal circle radius 1 coorY=new float[numPointsH]; // All the y-coor in a vertical circle radius 1 coorZ=new float[numPointsW]; // All the z-coor in a horizontal circle radius 1 multXZ=new float[numPointsH]; // The radius of each horizontal circle (that you will multiply with coorX and coorZ) for (int i=0; i<numPointsW ;i++) { // For all the points around the width float thetaW=i*2*PI/(numPointsW-1); coorX[i]=sin(thetaW); coorZ[i]=cos(thetaW); } for (int i=0; i<numPointsH; i++) { // For all points from top to bottom if (int(numPointsH_2pi/2) != (float)numPointsH_2pi/2 && i==numPointsH-1) { // If the numPointsH_2pi is odd and it is at the last pt float thetaH=(i-1)*2*PI/(numPointsH_2pi); coorY[i]=cos(PI+thetaH); multXZ[i]=0; } else { //The numPointsH_2pi and 2 below allows there to be a flat bottom if the numPointsH is odd float thetaH=i*2*PI/(numPointsH_2pi); //PI+ below makes the top always the point instead of the bottom. coorY[i]=cos(PI+thetaH); multXZ[i]=sin(thetaH); } } } void textureSphere(float rx, float ry, float rz, PImage t) { // These are so we can map certain parts of the image on to the shape float changeU=t.width/(float)(numPointsW-1); float changeV=t.height/(float)(numPointsH-1); float u=0; // Width variable for the texture float v=0; // Height variable for the texture beginShape(TRIANGLE_STRIP); texture(t); for (int i=0; i<(numPointsH-1); i++) { // For all the rings but top and bottom // Goes into the array here instead of loop to save time float coory=coorY[i]; float cooryPlus=coorY[i+1]; float multxz=multXZ[i]; float multxzPlus=multXZ[i+1]; for (int j=0; j<numPointsW; j++) { // For all the pts in the ring normal(-coorX[j]*multxz, -coory, -coorZ[j]*multxz); vertex(coorX[j]*multxz*rx, coory*ry, coorZ[j]*multxz*rz, u, v); normal(-coorX[j]*multxzPlus, -cooryPlus, -coorZ[j]*multxzPlus); vertex(coorX[j]*multxzPlus*rx, cooryPlus*ry, coorZ[j]*multxzPlus*rz, u, v+changeV); u+=changeU; } v+=changeV; u=0; } endShape(); }Help Converting to Arduino?The temperature data is used to generate a heatmap on a display screen . . . Is that not evident by the Processong sketch . . . Or am I misunderstanding your question?
Reposting HeatMap questionI have a couple of sketch's to display a heat map of random data. Ultimately the data will be generated from sensors in real time. The 1st sketch I am posting is too slow for my sensor display to be meaningful. I do not know if the interpolation algorithm is inefficient or it is plotting too many points or both. The 2nd sketch I am posting is a dumbed down version but has the speed but lacks resolution.
Any help or advice would be greatly appreciated.
Thanks,
Ken
Sketch #1:
int r = 8;  // number of rows in input array
int c = 8; // number of columns in input array
int t = 60;  // parameter (array resize factor)
int rows = (r-1)*t;  // height of the heat map
int cols = (c-1)*t;  // width of the heat map

float[][] array;  // input array
float[][] interp_array = new float[rows][cols]; // interpolated array

void setup() {
  size(420, 420);
  frameRate(10);
  noStroke();
}

void draw() {
  println();
  int startTime = millis();
  array = retrieveSensorData();
  println("retrieveSensorData() time: " + (millis()-startTime) + "ms");
  int beforeInterpolationTime = millis();
  bilinearInterpolation();
  println("bilinearInterpolation() time: " + (millis()-beforeInterpolationTime) + "ms");
  int beforeApplyColorTime = millis();
  applyColor();
  println("applyColor() time: " + (millis()-beforeApplyColorTime) + "ms");
  println("total time: " + (millis()-startTime) + "ms");
}

float[][] retrieveSensorData() {
  float[][] res = new float[r][c];

  for (int i=0; i<r; i++)
    for (int j=0; j<c; j++)
      res[i][j] = random(0, 6);

  return res;
}

void bilinearInterpolation() {  // Bi-linear Interpolation algorithm

  for (int i=0; i<r; i++) {
    for (int j=0; j<c; j++) {
      int x = j*t - 1;
      int y = i*t - 1;
      if (x<0)
        x=0;
      if (y<0)
        y=0;
      interp_array[y][x] = array[i][j];
    }
  }

  for (int y=0; y<rows; y++) {
    int dy1 = floor(y/(t*1.0));
    int dy2 = ceil(y/(t*1.0));
    int y1 = dy1*t - 1;
    int y2 = dy2*t - 1;
    if (y1<0)
      y1 = 0;
    if (y2<0)
      y2 = 0;
    for (int x=0; x<cols; x++) {
      int dx1 = floor(x/(t*1.0));
      int dx2 = ceil(x/(t*1.0));
      int x1 = dx1*t - 1;
      int x2 = dx2*t - 1;
      if (x1<0)
        x1 = 0;
      if (x2<0)
        x2 = 0;
      float q11 = array[dy1][dx1];
      float q12 = array[dy2][dx1];
      float q21 = array[dy1][dx2];
      float q22 = array[dy2][dx2];

      int count = 0;
      if (q11>0)
        count++;
      if (q12>0)
        count++;
      if (q21>0)
        count++;
      if (q22>0)
        count++;

      if (count>2) {
        if (!(y1==y2 && x1==x2)) {

          float t1 = (x-x1);
          float t2 = (x2-x);
          float t3 = (y-y1);
          float t4 = (y2-y);
          float t5 = (x2-x1);
          float t6 = (y2-y1);

          if (y1==y2) {
            interp_array[y][x] = q11*t2/t5 + q21*t1/t5;
          } else if (x1==x2) {
            interp_array[y][x] = q11*t4/t6 + q12*t3/t6;
          } else {
            float diff = t5*t6;
            interp_array[y][x] = (q11*t2*t4 + q21*t1*t4 + q12*t2*t3 + q22*t1*t3)/diff;
          }
        } else {
          interp_array[y][x] = q11;
        }
      } else {
        interp_array[y][x] = 0;
      }
    }
  }
}

void applyColor() {  // Generate the heat map

  color c1 = color(0, 0, 255);  // Blue color
  color c2 = color(0, 255, 0);  // Green color
  color c3 = color(255, 0, 0);  // Red color
  color c4 = color(255, 255, 0);  // Yellow color

  for (int i = 0; i < rows; i++) {
    for (int j = 0; j < cols; j++) {
      float value = interp_array[i][j];
      color c;
      float fraction;

      if (value>=1 && value<2) {
        fraction = (value-1)/1.0;
        c = lerpColor(c1, c2, fraction);
      } else if (value>=2 && value<3) {
        fraction = (value-2)/1.0;
        c = lerpColor(c2, c3, fraction);
      } else if (value>=3 && value<5) {
        fraction = (value-3)/2.0;
        c = lerpColor(c3, c4, fraction);
      } else
      c = c4;
      stroke(c);
      point(j, i);
    }
  }
}
Sketch #2:
void setup() { size(400, 400); noStroke(); frameRate(10); background(100); } color[] ColorArray = new color[64]; void draw() { int fillcolor = 0; for (int i = 0; i <= 63; i += 1) { float j = random(1, 6); int randomColor = int(j); switch(randomColor) { case 1: fillcolor=#FF1205; break; case 2: fillcolor=#E58E09; break; case 3: fillcolor=#FEFF00; break; case 4: fillcolor=#72FF00; break; case 5: fillcolor=#0700FF; break; } ColorArray[i] = fillcolor; } int j=0; for (int y = 0; y <= 350; y += 50) { for (int x = 0; x <= 175; x += 25) { for (int y1 = y; y1 <= y+41; y1 += 10) { for (int x1 = x; x1 <= x+ 21; x1 += 5) { fill(ColorArray[j]); rect(x, y, 25, 50); } } j=j+1; } } }Convert from RGB to gradient and backAh, a touch heatmap with no color rotation (you don't want it to cycle). Sounds like RGB (not HSB) and a defined set of steps is the way for you to go.
Is your goal to implement it yourself as a learning project, or do you just want high-performance pixel color shifting? If the second you might want to consider looking into whether you can use optimized libraries such as PixelFlow for gradients:
I am making a heatmap. I am trying to map a store and which parts of the store get the most sales.How can I load the data and make it so the parts of the store with the most sales are colored red and it fades to blue. I would love all of the help I can get! Thank you in advance.
Problem with 2D transformation..Hello, I'm trying to implement screen zooming in/out by axis from mouse position. My very first idea was this:
    translate(-mouseX,-mouseY);
    scale(scaling);
    translate(mouseX,mouseY);
Here is my code:
//Code Starts
void settings(){
  size(600,400,OPENGL);
}

void setup(){
  background(0);

  scaleLevel=1;
  xAxis=0;
  yAxis=0;
}

void draw(){
  background(0);
  transform();
  drawRects();
}

void drawRects(){
  for(int i=0; i<24;i++){
    for(int j=0; j<15; j++){
      fill(255);
      rectMode(LEFT);
      rect(i*25,j*25,i*25+20,j*25+20);
    }
  }
}

void mouseWheel(MouseEvent event) {

    //Update Scale Axis
    xAxis = mouseX;
    yAxis = mouseY;

    //This method controls scaleLevel variable
    if(event.getCount()==-1)
      scaleLevel += 0.2;
    else if(event.getCount()==1)
      if(scaleLevel>=1.2)
        scaleLevel -= 0.2;
      else
        scaleLevel = 1;

    System.out.println("Heatmap>> Scale Level: "+scaleLevel);
}

void transform(){
   translate(-1*xAxis,-1*yAxis);
   scale(scaleLevel);
}


float scaleLevel;
int xAxis;
int yAxis;
However, when I tested this, the axis seemed to move little bit more forward, which mouseX,Y wasn't the axis. sperate transformation worked fine, but when I come all three together, the result goes unpredictable.

 HELP!!!!
Guys I have a video of a street where the people is walking, etc. I want to graph the movement patterns of the people, not only one person but many of them walking on the street. Then I want to create a heatmap from that information showing the areas with more people walking by. Is it possible to do using Processing?
Looking to hire for short Processing project: A hyponym heatmapIn a prior Upwork project I worked with a developer to analyze some text to understand the most important nouns in that text. Now I need a Processing script that will allow me to:
- Play with visualizing the results, and
- Export them to a PDF for playing with further in Illustrator or Sketch
I'm beyond my Processing skill level to create it, but I think if someone else did it and commented it well, I might be able to modify it. Having no luck with Upwork candidates who know Processing, so turning here.
The script would:
- Let me input the URL of the shared Google Spreadsheet
- Generate an adjacency diagram based on the noun hyponym trees in WordNet
- Generate an icicle diagram based on the same data
- Fill in the cells of the diagrams per the data in the Google Spreadsheet
- Let me play with variables to adjust the visuals of the output
- Export the resulting diagram to a basic PDF
See descriptions about these two adjacency diagrams down on the page at Washington.edu.
See one example of an adjacency diagram here.This is a paid project, but I have no idea how complicated this is. If you are interested, please DM me with your sense of how long it would take, and what your hourly rate would be. Thanks!
