How to create a heatmap from list of X Y Points

edited February 2018 in How To...

Hello everyone,

I need to use processing to visualise some data from my school research. I have data of X Y position of user.For exemple:

-44 -23
-42 -22
-43 -24
-51 -30
-59 -36
-63 -39
-64 -39
-63 -38
-63 -38
-63 -38
-63 -38
-63 -38
-63 -38
-63 -38
-63 -37
-63 -36
-63 -35

I have to create a heatmap showing this array.

Some example of heatmap that I need:
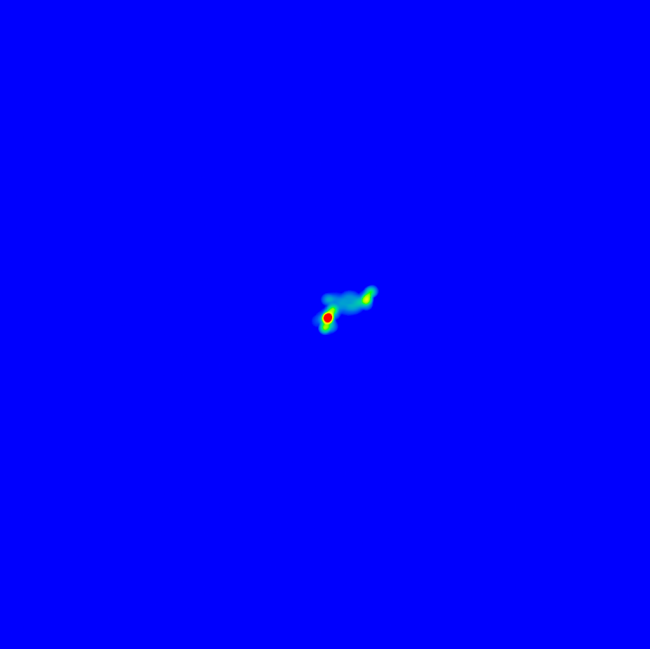
JK_praca_0003_BakeBOXP

Can anyone help me please? It is very important to me:(

Tagged:

Answers

  • the data doesn't come out right

    are there 2 lines or x alternates y?

  • o damn I mean x and y points:

    x y

    -44 -23

    -42 -22

    -43 -24

    -51 -30

    -59 -36

    -63 -39

    -64 -39

    -63 -38

    -63 -38

    -63 -38

    -63 -38

    -63 -38

    -63 -38

    -63 -38

    -63 -37

    -63 -36

    -63 -35

  • Have you explore prev posts? https://forum.processing.org/two/search?Search=heatmap

    A demonstration below.

    Kf

    //HeatMap demonstration using a hash map
    //REFERENCE:  https://forum.processing.org/two/discussion/26371/how-to-create-a-heatmap-from-list-of-x-y-points#latest
    //By Kf @ 15-Feb-2018
    
    //INSTRUCTIONS:
    //         *--  @Input a data set that is made of PVector values (Like an ArrayList container
    //         *--         Do this by using something similar to addOrUpdate() provided below
    
    //         *--  
    //         *--  The software will generate a heat map:
    //         *--  
    //         *--  The code will compute the data's max and min values from the x and y input values
    //         *--  Then it populates a hashTable defined by coordinates(key) and frequency(value)
    //         *--  The key, which is a PVector) is mapped against the sketch's width and height
    //         *--  The value is mapped between min and max color
    
    //===========================================================================
    // IMPORTS:
    import java.util.Comparator;
    import java.util.Map;
    import java.util.Collections;
    
    //===========================================================================
    // FINAL FIELDS:
    final color MINCOL=color(255, 10, 10);
    final color MAXCOL=color(10, 10, 255);
    
    //===========================================================================
    // GLOBAL VARIABLES:
    ArrayList<PVector> data;
    HashMap<PVector, Integer> table;
    
    //===========================================================================
    // PROCESSING DEFAULT FUNCTIONS:
    
    void settings() {
      size(600, 600);
    }
    
    void setup() {
      noLoop();
      textAlign(CENTER, CENTER);
      rectMode(RADIUS);
    
      noStroke();
    
      //INIT data set
      data=new ArrayList<PVector>();
    
      for (int i=0; i<100000; i++) {
        data.add(new PVector(floor(random(5, 55)), floor(random(0, 30))));
      }
    
      table=new HashMap<PVector, Integer>();
    
      //TESTING
      //============================================
      //PVector PVEC=new PVector(50, 50);
      //addOrUpdate(PVEC);
      //addOrUpdate(new PVector(1, 0));
      //addOrUpdate(PVEC);
      //addOrUpdate(PVEC);
      //println(table.get(PVEC));
    
      //for (Map.Entry me : table.entrySet()) {
      //  print(me.getKey() + " is ");
      //  println(me.getValue());
      //}
      //============================================
    
    
      //FIND min and max of X and Y components of input data set
      float[] range=getRange(data);
    
      //FEED data to hashMap
      for (PVector v : data) {
        addOrUpdate(v);
      }
    
      ////NEXT prints content of hashMap
      //for (Map.Entry me : table.entrySet()) {
      //  print(me.getKey() + " is ");
      //  println(me.getValue());
      //}
    
      float minInt=Collections.min(table.values());
      float maxInt=Collections.max(table.values());
    
      println("Repport ranges:");
      println(range);
      println("Report min and max intensities = ",minInt, maxInt);
    
      background(0);
      for (Map.Entry me : table.entrySet()) {
        PVector coord=(PVector)me.getKey();
        Integer val=(Integer)me.getValue();
    
        float px=map(coord.x, range[0], range[1], 0, width);
        float py=map(coord.y, range[2], range[3], height, 0);
        color c=lerpColor(MINCOL, MAXCOL, map(val, minInt, maxInt, 0, 1));
        fill(c);
        println(px, py, val);
        rect(px, py, width/(1.0*range[1]-range[0]), height/(1.0*range[3]-range[2]));
      }
    }
    
    
    //===========================================================================
    // OTHER FUNCTIONS:


    void addOrUpdate(PVector pi) {  
      table.put(pi, table.containsKey(pi) ?  table.get(pi)+1 : 1);
    }
    
    float[] getRange(ArrayList<PVector> in) {
    
      float minx=PApplet.MAX_INT;
      float maxx=PApplet.MIN_INT;
      float miny=PApplet.MAX_INT;
      float maxy=PApplet.MIN_INT;
      for (PVector pp : in) {
        if (pp.x<minx) minx=pp.x;
        if (pp.y<miny) miny=pp.y;
        if (pp.x>maxx) maxx=pp.x;
        if (pp.y>maxy) maxy=pp.y;
      }
    
      float[] r = {minx, maxx, miny, maxy};
      return r;
    }
    
  • Hi, Yes i saw this but this map look differentia than i need them - they are not blending , with ractangles it is much more unreadable

This discussion has been closed.