Howdy, Stranger!
We are about to switch to a new forum software. Until then we have removed the registration on this forum.
Categories
- All Categories 25.7K
- Announcements & Guidelines 13
- Common Questions 30
- Using Processing 22.1K
- Programming Questions 12.2K
- Questions about Code 6.4K
- How To... 4.2K
- Hello Processing 72
- GLSL / Shaders 292
- Library Questions 4K
- Hardware, Integration & Other Languages 2.7K
- Kinect 668
- Arduino 1K
- Raspberry PI 188
- Questions about Modes 2K
- Android Mode 1.3K
- JavaScript Mode 413
- Python Mode 205
- Questions about Tools 100
- Espanol 5
- Developing Processing 548
- Create & Announce Libraries 211
- Create & Announce Modes 19
- Create & Announce Tools 29
- Summer of Code 2018 93
- Rails Girls Summer of Code 2017 3
- Summer of Code 2017 49
- Summer of Code 2016 4
- Summer of Code 2015 40
- Summer of Code 2014 22
- p5.js 1.6K
- p5.js Programming Questions 947
- p5.js Library Questions 315
- p5.js Development Questions 31
- General 1.4K
- Events & Opportunities 288
- General Discussion 365
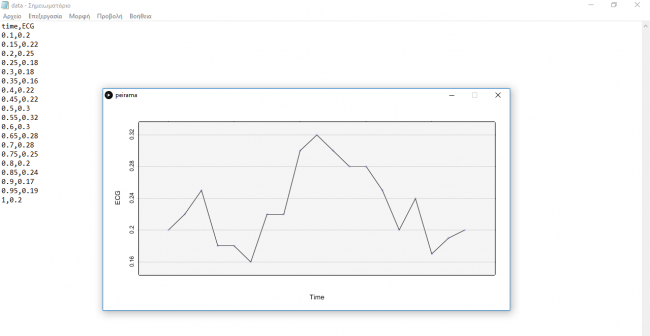
How can i numerate x axis in a graph?
This code bellow is about making a graph from, loading a csv file.My only problem is that i can not numerate the x axis, as you see in the picture of my graph bellow.But my y axis was numerated automatically.
import grafica.*;

GPlot plot;

Table table;

void setup() {
   size(800, 410);
  table = loadTable("data.csv", "header");
  table.setColumnType("time", Table.FLOAT);
  table.setColumnType("ECG", Table.FLOAT);

  GPointsArray points = new GPointsArray();
  float[] pointSizes = new float[table.getRowCount()];
   for (int row = 0; row < table.getRowCount(); row++) {
    Float time = table.getFloat(row,"time");
   Float ECG = table.getFloat(row,"ECG");

     points.add(time,ECG);
      pointSizes[row] =5;
  }
  plot = new GPlot(this);
  plot.setPos(0, 0);
  plot.setDim(700, 300);
  plot.setMar(60, 70, 40, 70);
  plot.getXAxis().setNTicks(0);
  plot.setPoints(points);
  plot.setPointColor(color(100, 100, 255, 50));
  plot.setPointSizes(pointSizes);
  plot.getYAxis().setAxisLabelText("ECG");
  plot.getXAxis().setAxisLabelText("Time");
  plot.setAxesOffset(1);
  plot.setTicksLength(1);


}
void draw() {
  background(255);

  // Draw the plot
 plot.beginDraw();
  //plot.defaultDraw();
  plot.drawBackground();
  plot.drawBox();
  plot.drawXAxis();
  plot.drawYAxis();
  plot.drawTopAxis();
  plot.drawRightAxis();
  plot.drawTitle();
  plot.drawPoints();
  plot.drawLines();
  plot.drawGridLines(GPlot.BOTH);
  plot.drawLines();
   plot.drawLabels();
  //plot.drawGridLines(GPlot.VERTICAL);
  //plot.drawFilledContours(GPlot.HORIZONTAL, 0);
  plot.endDraw();
 }

Best Answer
This discussion has been closed.

Answers
Not sure how this library works but in setup you have this for the x-axis but not for the y
plot.getXAxis().setNTicks(0);
Maybe comment out this line
As we discussed for the graph itself: it could also be that the data is not suitable.
Maybe float is wrong
In the version above I don’t see the innovations I brought in at all. Maybe my sketch works?
Thank you so much for your help.!!! I am grateful to you!!!
Yes, you are right!!! Th wrong line was plot.getXAxis().setNTicks(0);
Now i have numerated x- axis but i cant understand the numbers..I thin that the numbers in x-axis are wrong..
See other thread
please don't start multiple threads for the same bit of code, it gets confusing.