Howdy, Stranger!
We are about to switch to a new forum software. Until then we have removed the registration on this forum.
Categories
- All Categories 25.7K
- Announcements & Guidelines 13
- Common Questions 30
- Using Processing 22.1K
- Programming Questions 12.2K
- Questions about Code 6.4K
- How To... 4.2K
- Hello Processing 72
- GLSL / Shaders 292
- Library Questions 4K
- Hardware, Integration & Other Languages 2.7K
- Kinect 668
- Arduino 1K
- Raspberry PI 188
- Questions about Modes 2K
- Android Mode 1.3K
- JavaScript Mode 413
- Python Mode 205
- Questions about Tools 100
- Espanol 5
- Developing Processing 548
- Create & Announce Libraries 211
- Create & Announce Modes 19
- Create & Announce Tools 29
- Summer of Code 2018 93
- Rails Girls Summer of Code 2017 3
- Summer of Code 2017 49
- Summer of Code 2016 4
- Summer of Code 2015 40
- Summer of Code 2014 22
- p5.js 1.6K
- p5.js Programming Questions 947
- p5.js Library Questions 315
- p5.js Development Questions 31
- General 1.4K
- Events & Opportunities 288
- General Discussion 365
real time graph plotting using processing
i have to plot a graph in processing by the feedback from encoder motors of the bot. so i have two variables basically left motor encoder and right motor encoder. i planned to vary on in x-axis and another in y-axis. while i went through some of the codes on internet i found that, almost everyone has written the graph part code in serial event itself? so my first doubt is why do they write it in serial event() function rather than void draw()? another thing is when i tried to write my code for graph in void draw() it had a pseudo code something like this:
           xpos1=0,ypos1=height;
        void draw():
         line(xpos1,ypos1,xpos,height-ypos);// obviously the data(xpos,ypos) is mapped with the width and height of the processing ide window.
            xpos1=xpos;
            ypos1=height-ypos;
            if(xpos1>=width)
            {
              xpos1=0;
            }
            if(ypos1>=height)
            {
              ypos1=0;
            }
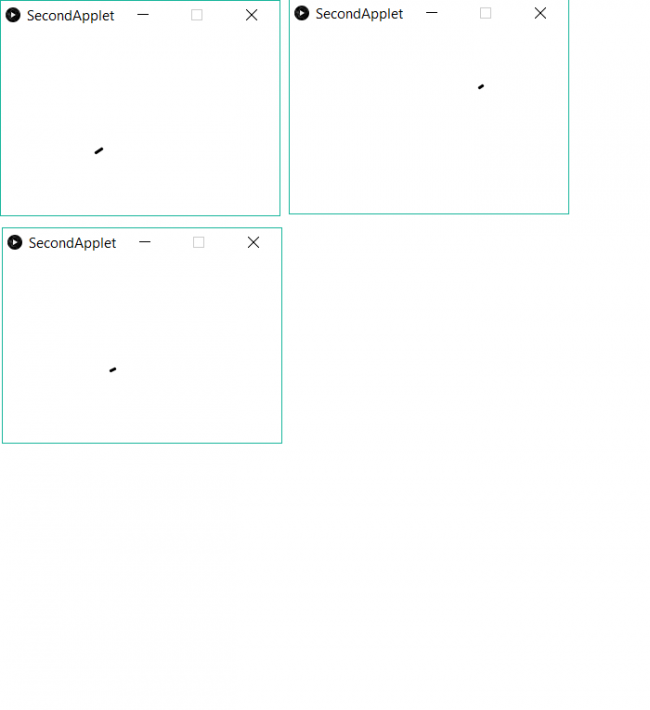
so i get to see only a small dot traversing on processing ide window and i cannot see the older path that my line has travelled which in the case of the sites which i described when wrote the similar piece of code in serial event() they had a whole graph getting made on the processing window. where am i getting wrong? please help me also is there any alternative to plot the graph using void draw()?i want to vary both xpos as well as ypos as i get two feedbacks form left motor and right motor. please help with the detailed answers.
 screenshot of my attempted graph in different frames
 screenshot of one of the graphs made by somewhat the similar code displayed above but written in the serial event() available on the internet:

Answers
Edit your post (gear icon in the top right corner of your post), select your code and hit ctrl+o to format your code. Make sure there is an empty line above and below your code.
I would prefer to draw directly in draw and not in serialEvent. These posts are relevant to you:
https://forum.processing.org/two/discussion/16618/processing-with-arduino-void-serialevent#Item_1
https://forum.processing.org/two/discussion/comment/88886#Comment_88886 https://forum.processing.org/two/discussion/comment/79484/#Comment_79484
https://forum.processing.org/two/discussion/22504/usable-oscilloscope-arduino-processing-using-class#latest
https://forum.processing.org/two/discussion/comment/98969/#Comment_98969
Kf
@kfrajer so are there any benefits if we draw the graph in serial event. also please give me the reason why can we see the full graph on these sites rather than the graph displaying on my window even though both of our codes are almost similar?(i want to know why the same code written by me is working fine on those sites and not with me when i use them it in void draw instead of serial event?). and please give me an alternative idea about the code that i have to write in order to plot the graph in both of the axes as i get two val from the arduino.
Second link above, check Trinity's posts on February 27th. Notice she provides both ino and pde files. That demo should do pretty close to what you want. I suggest you get the code running and ask question if you run into any issues.
Also comment in the nature of your signals you want to plot. What are they measuring, what is the input range of each signal, what resolution are you using in your arduino in each input, sampling rate? Also, is this your first time working with arduinos or have you done other projects? If it is your first time, then I suggest you start with only one sensor and use the first link in my previous post. Focus in @GoToLoop's snippet using the redraw approach. After you get it working for one sensor, you post your code. Then try the other sensor. These steps are very important to make sure you understand the signal you are working with and this will ensure each sensor and your setup is configured properly.
Kf