Howdy, Stranger!
We are about to switch to a new forum software. Until then we have removed the registration on this forum.
Categories
- All Categories 25.7K
- Announcements & Guidelines 13
- Common Questions 30
- Using Processing 22.1K
- Programming Questions 12.2K
- Questions about Code 6.4K
- How To... 4.2K
- Hello Processing 72
- GLSL / Shaders 292
- Library Questions 4K
- Hardware, Integration & Other Languages 2.7K
- Kinect 668
- Arduino 1K
- Raspberry PI 188
- Questions about Modes 2K
- Android Mode 1.3K
- JavaScript Mode 413
- Python Mode 205
- Questions about Tools 100
- Espanol 5
- Developing Processing 548
- Create & Announce Libraries 211
- Create & Announce Modes 19
- Create & Announce Tools 29
- Summer of Code 2018 93
- Rails Girls Summer of Code 2017 3
- Summer of Code 2017 49
- Summer of Code 2016 4
- Summer of Code 2015 40
- Summer of Code 2014 22
- p5.js 1.6K
- p5.js Programming Questions 947
- p5.js Library Questions 315
- p5.js Development Questions 31
- General 1.4K
- Events & Opportunities 288
- General Discussion 365
In this Discussion
- jeremydouglass May 2017
- mproc May 2017
- nabr May 2017
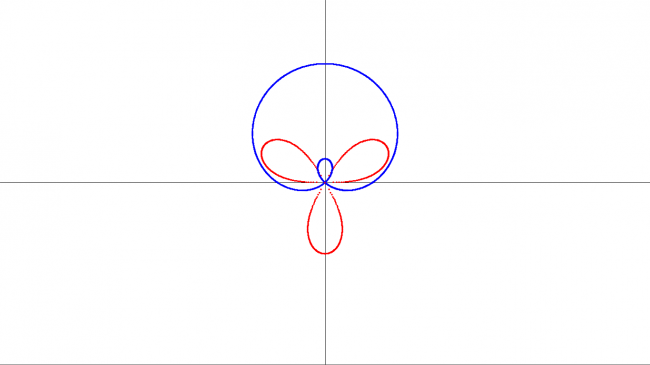
A program to plot polar equations
Hello All !
I wrote this program to plot polar equations. For demonstration, I have plotted two equations. You can control various parameters like curve equations, line thickness, line color, background color, etc. Kindly give your feedback and suggestions. You can use it for your work, if you like...
Many Thanks!
float t=0,w,h;
float r=0,theta=0,r1=0;

void setup(){

  fullScreen();
  background(255);

  h=height;
  w=width;

  /** DRAWING THE CO-ORDINATE AXES */
  strokeWeight(1);
  stroke(0);
  line(0,h/2,w,h/2);
  line(w/2,0,w/2,h);

  /** LINE THICKNESS */
  strokeWeight(3);
}

void draw(){

  /** SHIFTING THE ORIGIN TO CENTER OF THE SCREEN */
  translate(w/2,h/2);

  /** ROTATING TO THE POLAR ANGLE */
  theta=radians(t);
  rotate(theta);

  /** EQUATIONS FOR THE TWO CURVES */
  r=150*sqrt(sin(3*theta));
  r1=100+150*(sin(theta));

  /** PLOTTING THE FIRST CURVE */
  stroke(255,0,0);
  point(-r,0);

  /** PLOTTING THE SECOND CURVE */
  stroke(0,0,255);
  point(-r1,0);

  t+=0.25;
}


Comments
@mproc -- thank you so much for sharing this work! Very concise.
For a related discussion of cartesian plotting, see:
Note in particular the discussion at the end of the thread of point() vs. line() vs. PShape approaches to rendering. One of these alternate approaches might enable your red curve to be more connected as it approaches 0,0.
@jeremydouglas Thanks, but to understand your code is very difficult for me. I am just starting out with processing...
nice