Animating through a for-loop in python mode

edited May 2017 in Python Mode

I am attempting to loop through a 2D list in processing using python syntax drawing a map of food illness outbreaks for each month. I've been having numerous issues with bugs in the python module but this is what I have so far.

Example of file:

1998,1,Maryland,Salmonella,5
1998,1,California,Salmonella,26
1998,1,California,Salmonella,4
1998,2,Nebraska,Clostridium,45
1998,2,Florida,Clostridium,3
1998,2,Colorado,Clostridium,10

Code: import re def setup(): datafile = open('fooddata_1.txt','r') map_blank = loadImage('map_blank.jpg')

    for line in datafile:
        txt_re = re.search(r'(\d{4}),(\d{1,2}),(\w+\s*\w*),(\w+),(\d+)',line)
        datalist.append([txt_re.group(1),txt_re.group(2),txt_re.group(3),txt_re.group(4),txt_re.group(5)])

    background(0)
    size(1280,688)
    frameRate(1)
    noLoop()


datalist = []
statecoor = {
            'Alabama':[732,440],
            'Alaska':[272,573],
            'Arizona':[260,393],
            'Arkansas':[620,402],
            'California':[120,297],
            'Colorado':[385,300],
            'Connecticut':[1076,252],
            'Delaware':[1072,325],
            'Florida':[853,546],
            'Georgia':[801,440],
            'Hawaii':[121,562],
            'Idaho':[252,169],
            'Illinois':[671,273],
            'Indiana':[725,274],
            'Iowa':[598,234],
            'Kansas':[512,313],
            'Kentucky':[756,326],
            'Louisiana':[624,484],
            'Maine':[982,94],
            'Maryland':[989,340],
            'Massachusetts':[1104,174],
            'Michigan':[744,193],
            'Minnesota':[578,145],
            'Mississippi':[676,444],
            'Missouri':[616,317],
            'Montana':[342,102],
            'Nebraska':[493,245],
            'Nevada':[196,258],
            'New Hampshire':[954,156],
            'New Jersey':[1002,266],
            'New Mexico':[366,400],
            'New York':[901,177],
            'North Carolina':[872,358],
            'North Dakota':[484,110],
            'Ohio':[782,265],
            'Oklahoma':[526,385],
            'Oregon':[149,145],
            'Pennsylvania':[865,232],
            'Rhode Island':[1016,202],
            'South Carolina':[842,402],
            'South Dakota':[482,178],
            'Tennessee':[734,369],
            'Texas':[494,481],
            'Utah':[280,282],
            'Vermont':[932,144],
            'Virginia':[870,310],
            'Washington':[180,65],
            'Wisconsin':[652,173],
            'West Virginia':[822,292],
            'Wyoming':[361,201]

            }
sppcolor = {
            'Campylobacter': [204,114,62],
            'Clostridium': [86,204,62],
            'Escherichia': [255,114,103],
            'Listeria': [167,255,179],
            'Salmonella': [205,153,123]
            }


def draw():
    map_blank = loadImage('map_blank.jpg')
    image(map_blank,0,0)
    moniter = 1
    yriter = 1998

    for elements in datalist:
        yr = elements[0]
        mon = int(elements[1])
        state = elements[2]  
        species = elements[3]
        num = elements[4]  
        csize = 5*sqrt(float(num)/3.1415)

        spp = sppcolor[species]
        R = spp[0]
        G = spp[1]
        B = spp[2]

        coor = statecoor[state]
        x = coor[0]
        y = coor[1]

        if mon != moniter:
            image(map_blank,0,0)
            fill(R,G,B,125)
            noStroke()
            ellipse(x,y,csize,csize)

            fill(255)
            text(mon,1000,600)

            moniter += 1

        else:
            fill(R,G,B,125)
            noStroke()
            ellipse(x,y,csize,csize)

Map: map_blank
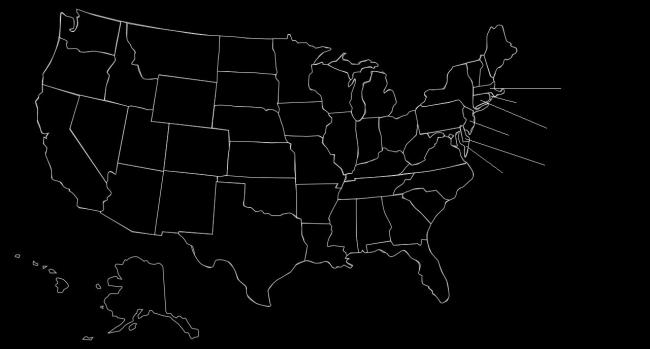
Unfortunately, with my current code I just end up with a map of the last month's outbreaks. I assume that this is because draw() loops through the whole file and then draws the final image. Is there a way that I can modify my code to force it to draw each month individually?

Thanks for all of your help!

Tagged:

Answers

  • @mbuck -- re:

    force it to draw each month individually

    How, specifically? Do you want a slow animation? Do you want to press spacebar for each new month, or right-left keys to navigate through them?

  • @jeremydouglass -- I'm just looking to make a slow animation, thanks

  • Could someone move this discussion thread to Processing.py?

    @mbuck -- for slow animation, for example:

    1. in setup, set a slow draw speed, e.g. frameRate(1);
    2. each time draw() is called load the next part of the data based on the new frameCount() (1,2,3,4...)

    Do you know what your moniter and yriter variables are currently doing to control which data is displayed?

  • I am (hoping) to use moniter to display all data from one month at a time and yeariter just as a way to allow me to display the year on the image.

    When I have tried to use frameRate() the image still rendered all at once only displaying the final month. So would I have to modify the code so that draw() is called after each line is read?

    Sorry, I'm not very well versed in processing. Thanks for you're help!

  • edited May 2017

    @mbuck -- draw() is automatically called looping at frameRate times per second, unless you shut this off with noLoop().

    So draw think of draw as a loop that updates the screen. frameCount is the loop counter -- although you can also create your own, like monitor, which should then be manually incremented at the beginning or end of draw(). You want to only display some of your data each draw loop iteration, so create an if statement based on the current counter that displays some rows (elements), but not others.

  • I changed my code to allow looping of draw() and printed several different variables and it looks like they are looping how I want them to. However, the image still isn't changing. It just displays the final month. I don't understand why that would be the case.

  • Post your latest code!

  • @jeremydouglass -- Here it is. I've only had success with some minor changes. Thanks again!

      import re
        def setup():
            datafile = open('fooddata_1.txt','r')
            map_blank = loadImage('map_blank.jpg')
    
        for line in datafile:
            txt_re = re.search(r'(\d{4}),(\d{1,2}),(\w+\s*\w*),(\w+),(\d+)',line)
            datalist.append([txt_re.group(1),txt_re.group(2),txt_re.group(3),txt_re.group(4),txt_re.group(5)])
    
        background(0)
        size(1280,688)
        frameRate(1)
        loop()
    
    
    datalist = []
    statecoor = {
                'Alabama':[732,440],
                'Alaska':[272,573],
                'Arizona':[260,393],
                'Arkansas':[620,402],
                'California':[120,297],
                'Colorado':[385,300],
                'Connecticut':[1076,252],
                'Delaware':[1072,325],
                'Florida':[853,546],
                'Georgia':[801,440],
                'Hawaii':[121,562],
                'Idaho':[252,169],
                'Illinois':[671,273],
                'Indiana':[725,274],
                'Iowa':[598,234],
                'Kansas':[512,313],
                'Kentucky':[756,326],
                'Louisiana':[624,484],
                'Maine':[982,94],
                'Maryland':[989,340],
                'Massachusetts':[1104,174],
                'Michigan':[744,193],
                'Minnesota':[578,145],
                'Mississippi':[676,444],
                'Missouri':[616,317],
                'Montana':[342,102],
                'Nebraska':[493,245],
                'Nevada':[196,258],
                'New Hampshire':[954,156],
                'New Jersey':[1002,266],
                'New Mexico':[366,400],
                'New York':[901,177],
                'North Carolina':[872,358],
                'North Dakota':[484,110],
                'Ohio':[782,265],
                'Oklahoma':[526,385],
                'Oregon':[149,145],
                'Pennsylvania':[865,232],
                'Rhode Island':[1016,202],
                'South Carolina':[842,402],
                'South Dakota':[482,178],
                'Tennessee':[734,369],
                'Texas':[494,481],
                'Utah':[280,282],
                'Vermont':[932,144],
                'Virginia':[870,310],
                'Washington':[180,65],
                'Wisconsin':[652,173],
                'West Virginia':[822,292],
                'Wyoming':[361,201]
    
                }
    sppcolor = {
                'Campylobacter': [204,114,62],
                'Clostridium': [86,204,62],
                'Escherichia': [255,114,103],
                'Listeria': [167,255,179],
                'Salmonella': [205,153,123]
                }
    
    
    def draw():
        map_blank = loadImage('map_blank.jpg')
        image(map_blank,0,0)
        moniter = 1
        yriter = 1998
    
        for elements in datalist:
            yr = elements[0]
            mon = int(elements[1])
            state = elements[2]  
            species = elements[3]
            num = elements[4]  
            csize = 5*sqrt(float(num)/3.1415)
    
            spp = sppcolor[species]
            R = spp[0]
            G = spp[1]
            B = spp[2]
    
            coor = statecoor[state]
            x = coor[0]
            y = coor[1]
            print(moniter)
    
            if mon != moniter:
                print(mon)
                image(map_blank,0,0)
                fill(R,G,B,125)
                noStroke()
                ellipse(x,y,csize,csize)
    
                fill(255)
                text(mon,1000,600)
    
                moniter += 1
    
    
            if mon == moniter:
                fill(R,G,B,125)
                noStroke()
                ellipse(x,y,csize,csize)
    
  • edited May 2017

    @mbuck -- a few thoughts:

    1. resize your map image so that it aligns with your data
    2. while testing, use input (such as key pressed) to change the index, and see what happens. add animation later once the data sequence is working.
    3. depending on whether you want one entry at a time or groups of entries (e.g. by month) you may want to use python slice [:] syntax to get a subset of your datalist.

    Here is a simplified example of some of these approaches, based on your code. Press RIGHT and LEFT keys to move through your sample data.

    # forum.processing.org/two/discussion/22301/animating-through-a-for-loop-in-python-mode
    
    import re
    index = 0
    datalist = []
    statecoor = {
        'Alabama': [732, 440],
        'Alaska': [272, 573],
        'Arizona': [260, 393],
        'Arkansas': [620, 402],
        'California': [120, 297],
        'Colorado': [385, 300],
        'Connecticut': [1076, 252],
        'Delaware': [1072, 325],
        'Florida': [853, 546],
        'Georgia': [801, 440],
        'Hawaii': [121, 562],
        'Idaho': [252, 169],
        'Illinois': [671, 273],
        'Indiana': [725, 274],
        'Iowa': [598, 234],
        'Kansas': [512, 313],
        'Kentucky': [756, 326],
        'Louisiana': [624, 484],
        'Maine': [982, 94],
        'Maryland': [989, 340],
        'Massachusetts': [1104, 174],
        'Michigan': [744, 193],
        'Minnesota': [578, 145],
        'Mississippi': [676, 444],
        'Missouri': [616, 317],
        'Montana': [342, 102],
        'Nebraska': [493, 245],
        'Nevada': [196, 258],
        'New Hampshire': [954, 156],
        'New Jersey': [1002, 266],
        'New Mexico': [366, 400],
        'New York': [901, 177],
        'North Carolina': [872, 358],
        'North Dakota': [484, 110],
        'Ohio': [782, 265],
        'Oklahoma': [526, 385],
        'Oregon': [149, 145],
        'Pennsylvania': [865, 232],
        'Rhode Island': [1016, 202],
        'South Carolina': [842, 402],
        'South Dakota': [482, 178],
        'Tennessee': [734, 369],
        'Texas': [494, 481],
        'Utah': [280, 282],
        'Vermont': [932, 144],
        'Virginia': [870, 310],
        'Washington': [180, 65],
        'Wisconsin': [652, 173],
        'West Virginia': [822, 292],
        'Wyoming': [361, 201]
    
    }
    sppcolor = {
        'Campylobacter': [204, 114, 62],
        'Clostridium': [86, 204, 62],
        'Escherichia': [255, 114, 103],
        'Listeria': [167, 255, 179],
        'Salmonella': [205, 153, 123]
    }
    
    def setup():
        global map_blank
        datafile = open('fooddata_1.txt', 'r')
        map_blank = loadImage('map_blank.jpg')
    
        for line in datafile:
            txt_re = re.search(r'(\d{4}),(\d{1,2}),(\w+\s*\w*),(\w+),(\d+)', line)
            datalist.append([txt_re.group(1), txt_re.group(
                2), txt_re.group(3), txt_re.group(4), txt_re.group(5)])
    
        background(0)
        size(1280, 688)
        loop()
    
    def draw():
        image(map_blank, 0, 0, width, height)
        elements = datalist[index]
        yr = elements[0]
        mon = int(elements[1])
        state = elements[2]
        species = elements[3]
        num = elements[4]
    
        noStroke()
    
        spp = sppcolor[species]
        R = spp[0]
        G = spp[1]
        B = spp[2]
        fill(R, G, B, 125)
    
        csize = 10 * sqrt(float(num) / 3.1415) # 5 *
        coor = statecoor[state]
        x = coor[0]
        y = coor[1]
        ellipse(x, y, csize, csize)
    
        fill(255)
        estr = str(yr) + " " + str(mon) + " " + state + " " + species + " " + str(num)
        text(estr, 1000, 600)
    
    def keyPressed(): 
        global index
        if keyCode==RIGHT:
            index = index+1
        if keyCode==LEFT:
            index = index-1
        index = constrain(index, 0, len(datalist)-1)
    
Sign In or Register to comment.