Howdy, Stranger!
We are about to switch to a new forum software. Until then we have removed the registration on this forum.
Categories
- All Categories 25.7K
- Announcements & Guidelines 13
- Common Questions 30
- Using Processing 22.1K
- Programming Questions 12.2K
- Questions about Code 6.4K
- How To... 4.2K
- Hello Processing 72
- GLSL / Shaders 292
- Library Questions 4K
- Hardware, Integration & Other Languages 2.7K
- Kinect 668
- Arduino 1K
- Raspberry PI 188
- Questions about Modes 2K
- Android Mode 1.3K
- JavaScript Mode 413
- Python Mode 205
- Questions about Tools 100
- Espanol 5
- Developing Processing 548
- Create & Announce Libraries 211
- Create & Announce Modes 19
- Create & Announce Tools 29
- Summer of Code 2018 93
- Rails Girls Summer of Code 2017 3
- Summer of Code 2017 49
- Summer of Code 2016 4
- Summer of Code 2015 40
- Summer of Code 2014 22
- p5.js 1.6K
- p5.js Programming Questions 947
- p5.js Library Questions 315
- p5.js Development Questions 31
- General 1.4K
- Events & Opportunities 288
- General Discussion 365


Answers
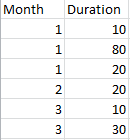
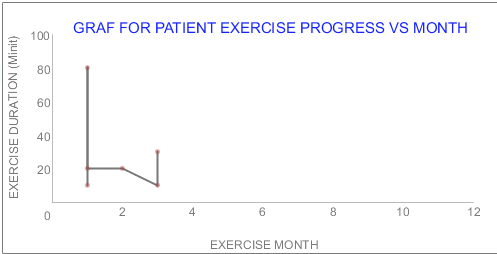
Program as below and my output as attach. How to add duration in month 1?
import org.gicentre.utils.stat.*; // For chart classes.
// Simple scatterplot compating income and life expectancy.
XYChart progressgraph;
// Loads data into the chart and customises its appearance. void setup() { size(500,250);
textFont(createFont("Arial",11),11);
// Both x and y data set here.
progressgraph = new XYChart(this);
// Load in data from a file // (first line of file contains column headings). String[] data = loadStrings("data.csv"); float[] Month = new float[data.length-1]; float[] Duration = new float[data.length-1];
for (int i=0; i<data.length-1; i++) { String[] Coloumn = data[i+1].split(","); Month [i] = Float.parseFloat(Coloumn[0]);
Duration[i] = Float.parseFloat(Coloumn[1]); }
Please edit your post, select your code and hit ctrl+o to format your code. Make sure there is an empty line above and below your code.
Please also check the reference for an example of how to use split or splitTokens. Go To processing.org and then check under Reference.
Kf
Dear kfrajer, below is my code
i want like below picture and x axis is show 1,2,3,4,5,6,7,8,9,10,11,12
Next assumes your data from your csv file is sorted.
Add this to the top of your sketch so to have global scope:
Add next in setup:
Replace lines 20 to 26 for this modified version:
The information you want is displayed in the console. For more information about manipulating ArrayList, check the reference under the following entries: ArrayList, FloatList.
Kf
Dear kfrajer, so this code is like that right.but the display still same
Replace this line 45 in your previous post with
progressgraph.setData(monthAcum.array() ,durationAcum.array());Kf
Thank you very much kfrajer.Now i get what i want.Thank you