Howdy, Stranger!
We are about to switch to a new forum software. Until then we have removed the registration on this forum.
Categories
- All Categories 25.7K
- Announcements & Guidelines 13
- Common Questions 30
- Using Processing 22.1K
- Programming Questions 12.2K
- Questions about Code 6.4K
- How To... 4.2K
- Hello Processing 72
- GLSL / Shaders 292
- Library Questions 4K
- Hardware, Integration & Other Languages 2.7K
- Kinect 668
- Arduino 1K
- Raspberry PI 188
- Questions about Modes 2K
- Android Mode 1.3K
- JavaScript Mode 413
- Python Mode 205
- Questions about Tools 100
- Espanol 5
- Developing Processing 548
- Create & Announce Libraries 211
- Create & Announce Modes 19
- Create & Announce Tools 29
- Summer of Code 2018 93
- Rails Girls Summer of Code 2017 3
- Summer of Code 2017 49
- Summer of Code 2016 4
- Summer of Code 2015 40
- Summer of Code 2014 22
- p5.js 1.6K
- p5.js Programming Questions 947
- p5.js Library Questions 315
- p5.js Development Questions 31
- General 1.4K
- Events & Opportunities 288
- General Discussion 365
In this Discussion
- jeremydouglass March 2017
Interpolating points between dates on a graph
So i'm trying to create a graph with the grafica library, and I have preset data with x/y axis already. The x axis is a timeline of dates at random intervals. What's the best to interpolate the points so that every day has an interpolated point so the graph appears smooth.
To see an example of how my graph currently looks, check out this example:
import grafica.*;

GPlot plot;
GPointsArray myArray = new GPointsArray(0);
int nPoints = 100;

void setup() {
  size(500, 350);

  plot = new GPlot(this, 0, 0, 500, 350);
  myArray = new GPointsArray(nPoints);

  for (int i = 0; i < nPoints; i = i + (int)(random(1,15))) {
    myArray.add(i, 10*noise(0.1*i));
  }

  plot.setPoints(myArray);
  plot.defaultDraw();
}
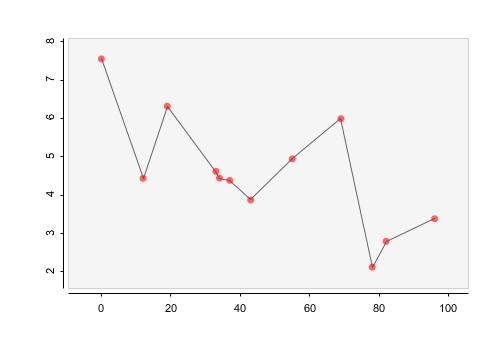
It will come out something like this:

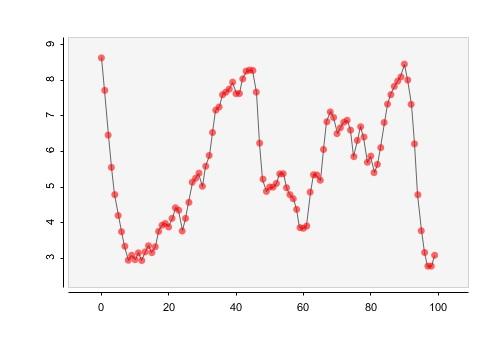
It should come out like this where instead of points every 1-15 ticks, it would be every tick.

Edit: And I read about lerp() and map() but i'm not sure how to actually apply it
Tagged:


Answers
@Joey --
Your question relates to "curve fitting" and "smoothing" of data. Based on your explanation it seems you are more interested in curve fitting, and perhaps specifically approaches such as polynomial regression.
There are many ways of doing fitting -- many different algorithms -- and producing output that is reasonable is highly dependent on what your data is. Also, it is generally bad form to hide your original, low-resolution data and fake high-resolution data. Instead, show the fit curve without points and in addition to (on top of) the point data that you used to generate it. The low resolution data may not look as good, but it is usually more honest and less speculative.
Where is your data coming from? If Grafica doesn't support polynomial fit curves and you don't want to implement them yourself (they are parametrized and fiddly) then you may want to generate your smoothed data wherever you are working with your real data, before the sketch -- R, Python, whatever,