Howdy, Stranger!
We are about to switch to a new forum software. Until then we have removed the registration on this forum.
Categories
- All Categories 25.7K
- Announcements & Guidelines 13
- Common Questions 30
- Using Processing 22.1K
- Programming Questions 12.2K
- Questions about Code 6.4K
- How To... 4.2K
- Hello Processing 72
- GLSL / Shaders 292
- Library Questions 4K
- Hardware, Integration & Other Languages 2.7K
- Kinect 668
- Arduino 1K
- Raspberry PI 188
- Questions about Modes 2K
- Android Mode 1.3K
- JavaScript Mode 413
- Python Mode 205
- Questions about Tools 100
- Espanol 5
- Developing Processing 548
- Create & Announce Libraries 211
- Create & Announce Modes 19
- Create & Announce Tools 29
- Summer of Code 2018 93
- Rails Girls Summer of Code 2017 3
- Summer of Code 2017 49
- Summer of Code 2016 4
- Summer of Code 2015 40
- Summer of Code 2014 22
- p5.js 1.6K
- p5.js Programming Questions 947
- p5.js Library Questions 315
- p5.js Development Questions 31
- General 1.4K
- Events & Opportunities 288
- General Discussion 365
In this Discussion
- jeremydouglass March 2017
- Joey March 2017
- kfrajer March 2017
grafica ending and then redrawing lines on same layer
How can I add a bunch of points to a grafica layer and have it cut off at certain point, but then have it start drawing lines again later. This all has the be on the same plot layer. To help visualize my question look at this simple code:
import grafica.*;

GPlot plot;

GPointsArray myArray = new GPointsArray(0);

void setup() {
  size(500, 500);

  plot = new GPlot(this, 0, 0, 500, 500);

  myArray.add(0, 0);
  myArray.add(1, 1);
  myArray.add(2, 2);
  myArray.add(3, 3);
  myArray.add(4, 4);
  myArray.add(5, 5);

  plot.setPoints(myArray);
  plot.defaultDraw();
}
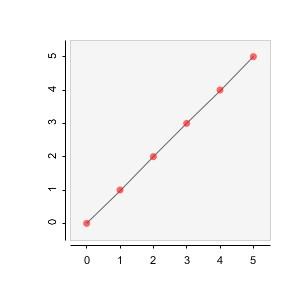
It creates this graph:

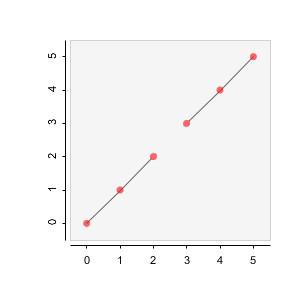
I need it to appear like this by "ending" the line at (2,2) and then start drawing again at (3,3):

I'm sure there's an easy way to pull this off that i'm not seeing...I imported a large data set and manually creating new layers for each cut off point seems unrealistic.
Tagged:


Answers
This confuses me. There must be something about your data that I'm not understanding from your example.
How do you know where these "certain point" cut-points should be if they aren't in your data set? If they are in your data set, why not just use them to generate layers?
@jeremydouglass My dataset displays the top 5 people for each time period. Depending on the period new people come in/out. Here's an example JSON:
    {"timeline": [
        {
            "x": 1,
            "people": [
                {"Name": "Bob", "y": 8},
                {"Name": "May", "y": 7},
                {"Name": "Joe", "y": 4},
                {"Name": "Larry", "y": 2},
                {"Name": "Jamie", "y": 2}
            ]
        },
        {
            "x": 2,
            "people": [
                {"Name": "Bob", "y": 12},
                {"Name": "Joe", "y": 9},
                {"Name": "May", "y": 8},
                {"Name": "Larry", "y": 5},
                {"Name": "Aaron", "y": 4}
            ]
        },
        {
            "x": 3,
            "people": [
                {"Name": "Bob", "y": 21},
                {"Name": "Joe", "y": 19},
                {"Name": "May", "y": 16},
                {"Name": "Larry", "y": 11},
                {"Name": "Aaron", "y": 9}
            ]
        },
        {
            "x": 4,
            "people": [
                {"Name": "May", "y": 32},
                {"Name": "Bob", "y": 29},
                {"Name": "Joe", "y": 22},
                {"Name": "Larry", "y": 19},
                {"Name": "Jamie", "y": 14}
            ]
        }
    ]}
Notice how "Jamie" was in the first object, but fell out of the list until the very last one and re-appeared.
The the graph will come out looking like in this video where people appear on the graph and end at certain times.
I hope that makes sense...thanks for your help
Ok I figured this out. Adding a NaN as a point will make grafica cut the line. So the solution to my first example would look like this:
Great. Thxs for sharing your answer.
Kf