Howdy, Stranger!
We are about to switch to a new forum software. Until then we have removed the registration on this forum.
Categories
- All Categories 25.7K
- Announcements & Guidelines 13
- Common Questions 30
- Using Processing 22.1K
- Programming Questions 12.2K
- Questions about Code 6.4K
- How To... 4.2K
- Hello Processing 72
- GLSL / Shaders 292
- Library Questions 4K
- Hardware, Integration & Other Languages 2.7K
- Kinect 668
- Arduino 1K
- Raspberry PI 188
- Questions about Modes 2K
- Android Mode 1.3K
- JavaScript Mode 413
- Python Mode 205
- Questions about Tools 100
- Espanol 5
- Developing Processing 548
- Create & Announce Libraries 211
- Create & Announce Modes 19
- Create & Announce Tools 29
- Summer of Code 2018 93
- Rails Girls Summer of Code 2017 3
- Summer of Code 2017 49
- Summer of Code 2016 4
- Summer of Code 2015 40
- Summer of Code 2014 22
- p5.js 1.6K
- p5.js Programming Questions 947
- p5.js Library Questions 315
- p5.js Development Questions 31
- General 1.4K
- Events & Opportunities 288
- General Discussion 365
please please can someone help me with this codemy submission is in few hours or i will fail
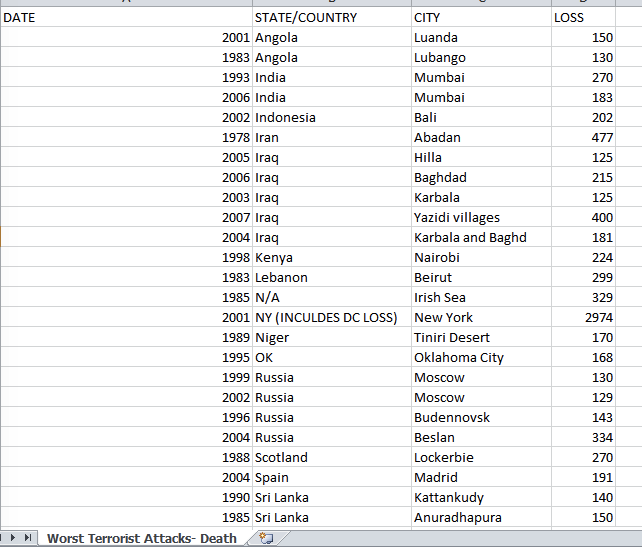
I need to make a simple bar chart or anything to put in my sketch every time i try to link the data it gives me errors can you help.
PImage img;
Drop[] drops = new Drop[300];

void setup() {
  size(900, 900);
  background(0);
   stroke(255);
   img = loadImage("http://" + "www.paperhi.com/thumbnails/detail/20130314/black%20and%20white%20maps%20continents%20time%20zones%20world%20map%20cartography%202560x1600%20wallpaper_www.paperhi.com_38.jpg");
 imageMode (CENTER);
  for (int i = 0; i < drops.length; i++) {
    drops[i] = new Drop();
  }
}

void draw() {

  background(0);

  // Draw the image upper centred of the sketch.
  image(img,500,200,1000, 400);
  //Change image transparency.
  tint(255,127);
  for (int i = 0; i < drops.length; i++) {
    drops[i].fall();
    drops[i].show();
  }
}

class Drop {
  float x = random(width);
  float y = random(-500, -200);
  float z = random(0, 20);
  float len = map(z, 0, 20, 10, 20);
  float yspeed = map(z, 0, 10, 1, 10);

  void fall() {
    y = y + yspeed;
    float grav = map(z, 0, 20, 0, 0.2);
    yspeed = yspeed + grav;

    if (y > height) {
      y = random(-200, -100);
      yspeed = map(z, 0, 20, 4, 10);
    }
  }

  void show() {
   stroke (127,0,0);
    line(x, y, x, y+len);
  }
}
I just need any chart like a line graph or anything bar chart to link this data  how can i do this I need to show the Date and the how the deaths increased
please help
Thanks

Answers
there's nothing in the code that links to any data... what have you tried?
and that data is a png - no use to us...
I didn't include the bar chart code yet I am trying this one but still it doesnt calculate anything. i cant upload a csv file to this fourm :c
import org.gicentre.utils.stat.*; // For chart classes.
// Displays a simple line chart representing a time series.
XYChart lineChart;
// Loads data into the chart and customises its appearance. void setup() { size(500,200); textFont(createFont("Arial",10),10);
// Both x and y data set here.
lineChart = new XYChart(this); lineChart.setData(new float[] {1970, 1980, 1990, 2000, 2002, 2003, 2004, 2005, 2006, 2007}, new float[] { 100, 200, 300, 400, 500, 600, 700, 800, 900, 1000, 2000});
// Axis formatting and labels. lineChart.showXAxis(true); lineChart.showYAxis(true); lineChart.setMinY(0);
lineChart.setYFormat("Deaths"); // Monetary value in $US lineChart.setXFormat("Date"); // Year
// Symbol colours lineChart.setPointColour(color(180,50,50,100)); lineChart.setPointSize(5); lineChart.setLineWidth(2); }
// Draws the chart and a title. void draw() { background(255); textSize(9); lineChart.draw(15,15,width-30,height-30);
// Draw a title over the top of the chart. fill(120); textSize(20); text("The horrors of terrorism", 70,30); textSize(11); text("Worst terrorist attacks where deaths are over 100", 70,45); }
just post the 5 lines of the csv?
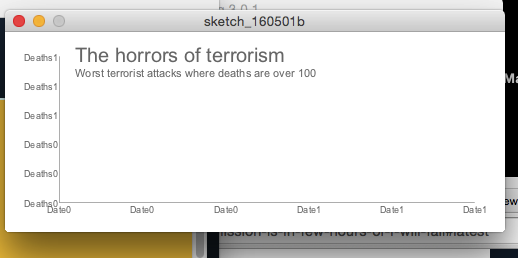
I am the number one beginner in this sorry guys i know this is stupid, this is the code i'm working on in the image it doesnt write the years and the number of deaths how do i fix that? and how do I actually write the function to present the line chart
import org.gicentre.utils.stat.*; // For chart classes.
// Displays a simple line chart representing a time series.
XYChart lineChart;
// Loads data into the chart and customises its appearance. void setup() { size(500,200); textFont(createFont("Arial",10),10);
// Both x and y data set here.
lineChart = new XYChart(this); lineChart.setData(new float[] {1970, 1980, 1990, 2000, 2002, 2003, 2004, 2005, 2006, 2007}, new float[] { 100, 200, 300, 400, 500, 600, 700, 800, 900, 1000, 2000});
// Axis formatting and labels. lineChart.showXAxis(true); lineChart.showYAxis(true); lineChart.setMinY(0);
lineChart.setYFormat("Deaths"); // Monetary value in $US lineChart.setXFormat("Date"); // Year
// Symbol colours lineChart.setPointColour(color(180,50,50,100)); lineChart.setPointSize(5); lineChart.setLineWidth(2); }
// Draws the chart and a title. void draw() { background(255); textSize(9); lineChart.draw(15,15,width-30,height-30);
// Draw a title over the top of the chart. fill(120); textSize(20); text("The horrors of terrorism", 70,30); textSize(11); text("Worst terrorist attacks where deaths are over 100", 70,45); }
https://forum.processing.org/two/discussion/16336/data-visualization-biomass#latest