Howdy, Stranger!
We are about to switch to a new forum software. Until then we have removed the registration on this forum.
Categories
- All Categories 25.7K
- Announcements & Guidelines 13
- Common Questions 30
- Using Processing 22.1K
- Programming Questions 12.2K
- Questions about Code 6.4K
- How To... 4.2K
- Hello Processing 72
- GLSL / Shaders 292
- Library Questions 4K
- Hardware, Integration & Other Languages 2.7K
- Kinect 668
- Arduino 1K
- Raspberry PI 188
- Questions about Modes 2K
- Android Mode 1.3K
- JavaScript Mode 413
- Python Mode 205
- Questions about Tools 100
- Espanol 5
- Developing Processing 548
- Create & Announce Libraries 211
- Create & Announce Modes 19
- Create & Announce Tools 29
- Summer of Code 2018 93
- Rails Girls Summer of Code 2017 3
- Summer of Code 2017 49
- Summer of Code 2016 4
- Summer of Code 2015 40
- Summer of Code 2014 22
- p5.js 1.6K
- p5.js Programming Questions 947
- p5.js Library Questions 315
- p5.js Development Questions 31
- General 1.4K
- Events & Opportunities 288
- General Discussion 365
In this Discussion
- benja December 2015
Create a graph (live-feed or after data collection) of sensor data from an Arduino serial port
Hi,
I have a code which takes data from 2 sensors that is incoming through the serial port of an Arduino and outputs it into a .csv file. This data is received as a float of the format "y, x" which is then delimited/split by the use of the comma and put into an array. The "y" data is a depth in mm measurement and the "x" is a correlating distance moved in mm.
I have been trying to get the code to output either a live-feed line graph or a line graph after the file is written with data "x" on the x-axis and "y" on the y-axis.
My experience with Processing is very limited and I have tried with no luck to adapt pretty much all of the examples I could find on the various forums and tutorials. Any help that could be offered would be very gratefully received, I don't mind if the solution is live-feed or after the .csv is written just having a graph out would be great.
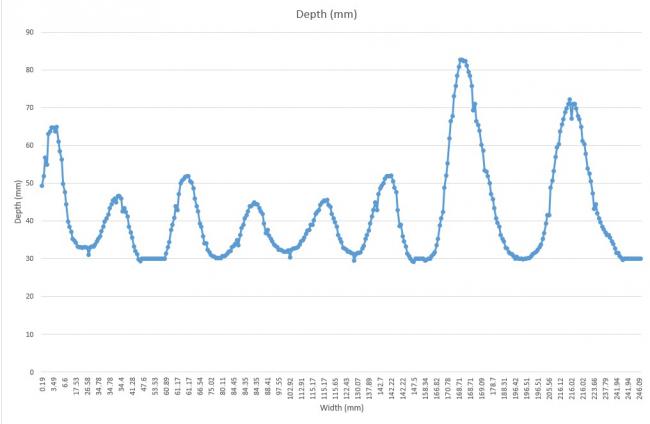
Below I have shown a plot I did manually in excel to show the kind of output I am trying to get as well as the code I have got already which I have annotated on to try to make understanding my process as pain-free as possible.

import processing.serial.*;
Serial myPort; //creates a software serial port
Table dataTable; //table where values are stored
Table table;

int numReadings = 500; //number of readings from sensors until .csv file is written
int readingCounter = 0; //counts each reading to compare to numReadings.

String val;
String fileName;

void setup()
{
  String portName = Serial.list()[0]; //defines COM port

  myPort = new Serial(this, portName, 9600); //port setup, 9600 baud rate

  table = new Table();

  //table.addColumn("id"); //id number for incoming data starting

  //the following adds columns for time. (currently not used)
  //table.addColumn("year");
  //table.addColumn("month");
  //table.addColumn("day");
  //table.addColumn("hour");
  //table.addColumn("minute");
  //table.addColumn("second");
  //table.addColumn("milliseconds");

  //the following adds columns for each sensor set. Change for sensors and keep in correct order.
  table.addColumn("Depth");
  table.addColumn("Width");

}

void serialEvent(Serial myPort){

  try {
  val = myPort.readStringUntil('\n'); //The newline separator separates each Arduino loop and so collection of data.
  if (val!= null) { //Verifies reading
    val = trim(val); //gets rid of any whitespace or Unicode nonbreakable space
    println(val); //Shows received data
    float sensorVals[] = float(split(val, ',')); //parses the packet from Arduino and places the float values into the sensorVals array.

    TableRow newRow = table.addRow(); //adds a row for new reading
    //following not used at present
    //newRow.setInt("id", table.lastRowIndex());//record an id for readings

    //record time stamp
    //newRow.setInt("year", year());
    //newRow.setInt("month", month());
    //newRow.setInt("day", day());
    //newRow.setInt("hour", hour());
    //newRow.setInt("minute", minute());
    //newRow.setInt("second", second());

    //record sensor information. Make sure same as sensor column names.
    newRow.setFloat("Depth", sensorVals[0]);
    newRow.setFloat("Width", sensorVals[1]);

    readingCounter++; //writes file every numReadings reading cycles

    //saves the table as a csv in the same folder as the sketch every numReadings.
    if (readingCounter % numReadings ==0)//checks number of readings is correct
    {
      fileName = str(year()) + str(month()) + str(day()) + str(table.lastRowIndex()); //filename is of the form year+month+day+readingCounter
      saveTable(table, fileName + ".csv"); //saves the data as a .csv
    }
   }
  }
  catch(RuntimeException e) {//catches errors
    e.printStackTrace();
  }

}

void draw () {

}
Sam


Answers
Here is an example that draws such a graph. It gets more complex if you have to scale it automatically to fit the screen, but maybe it's a starting point.