Howdy, Stranger!
We are about to switch to a new forum software. Until then we have removed the registration on this forum.
Categories
- All Categories 25.7K
- Announcements & Guidelines 13
- Common Questions 30
- Using Processing 22.1K
- Programming Questions 12.2K
- Questions about Code 6.4K
- How To... 4.2K
- Hello Processing 72
- GLSL / Shaders 292
- Library Questions 4K
- Hardware, Integration & Other Languages 2.7K
- Kinect 668
- Arduino 1K
- Raspberry PI 188
- Questions about Modes 2K
- Android Mode 1.3K
- JavaScript Mode 413
- Python Mode 205
- Questions about Tools 100
- Espanol 5
- Developing Processing 548
- Create & Announce Libraries 211
- Create & Announce Modes 19
- Create & Announce Tools 29
- Summer of Code 2018 93
- Rails Girls Summer of Code 2017 3
- Summer of Code 2017 49
- Summer of Code 2016 4
- Summer of Code 2015 40
- Summer of Code 2014 22
- p5.js 1.6K
- p5.js Programming Questions 947
- p5.js Library Questions 315
- p5.js Development Questions 31
- General 1.4K
- Events & Opportunities 288
- General Discussion 365
In this Discussion
- GoToLoop October 2015
- yousufalin October 2015
Drawing a cross chart visualization
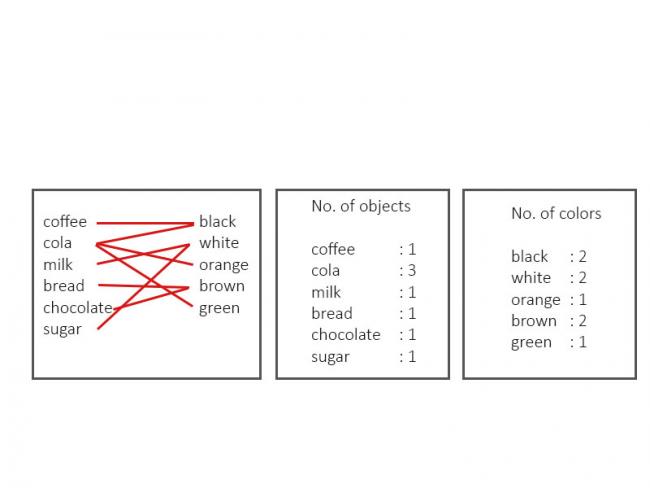
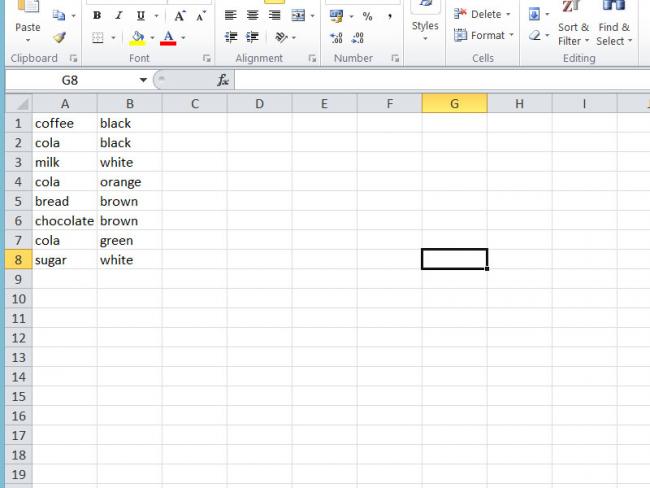
I was trying to create a small diagram based on the data from a csv file. I created a two columns of data where the first column displays name of few drinks and objects, and the second column displays their color. I wanted to create a diagram as i drew in the concept sketch shown below.
 Concept image

image showing the content inside the csv file
I was able to count and list down the repeating members in both the columns. But I am not able to create the connecting lines.
the code so far is as follows
String tag = "dataset.csv";
String []rawData;

IntDict drinks;
IntDict colors;

void setup() {
  size(600, 600);

  drinks = new IntDict();
  colors = new IntDict();

  rawData = loadStrings(tag);

  for (int i =0; i<rawData.length; i++) {
    String [] thisRow = split(rawData[i], ",");

    //  drinks.increment(thisRow[1]);
    drinks.increment(thisRow[0]);
    colors.increment(thisRow[1]);
  }
  println(drinks);
  println(colors);

  String [] drinkName = drinks.keyArray();
  int [] drinkNo = drinks.valueArray();

  String [] colorName = colors.keyArray();
  int [] colorNo = colors.valueArray();

  for (int i = 0; i<drinkName.length; i++) {

    fill(0);
    textSize(15);
    text(drinkName[i]+":"+drinkNo[i], 100, 100+30*i);

    line(100, 100+30*i, 300, 100+30*i);
  }
  for (int i = 0; i<colorName.length; i++) {

    fill(0);
    textSize(15);
    text(colorName[i]+":"+colorNo[i], 300, 100+30*i);

  }

}
It would be great if someone can help me with this.
Many thanks in advance:)
Yousuf
Tagged:

Answers
http://StackOverflow.com/questions/33160079/creating-a-rank-list-by-sorting-an-array
http://StackOverflow.com/questions/33200984/drawing-a-cross-chart-visualization-using-processing
@GoToLoop thank you for suggesting me to read hashmap and stringlist. i shall start with that. i must say ur previous suggestion to read about indDict was really helpful. :)
l posted the same questions in stackoverflow also to learn more and find answers :)
@GoToLoop thank you for the reply :)
I now have to study this as usual :)