Howdy, Stranger!
We are about to switch to a new forum software. Until then we have removed the registration on this forum.
Categories
- All Categories 25.7K
- Announcements & Guidelines 13
- Common Questions 30
- Using Processing 22.1K
- Programming Questions 12.2K
- Questions about Code 6.4K
- How To... 4.2K
- Hello Processing 72
- GLSL / Shaders 292
- Library Questions 4K
- Hardware, Integration & Other Languages 2.7K
- Kinect 668
- Arduino 1K
- Raspberry PI 188
- Questions about Modes 2K
- Android Mode 1.3K
- JavaScript Mode 413
- Python Mode 205
- Questions about Tools 100
- Espanol 5
- Developing Processing 548
- Create & Announce Libraries 211
- Create & Announce Modes 19
- Create & Announce Tools 29
- Summer of Code 2018 93
- Rails Girls Summer of Code 2017 3
- Summer of Code 2017 49
- Summer of Code 2016 4
- Summer of Code 2015 40
- Summer of Code 2014 22
- p5.js 1.6K
- p5.js Programming Questions 947
- p5.js Library Questions 315
- p5.js Development Questions 31
- General 1.4K
- Events & Opportunities 288
- General Discussion 365
Measuring Plant, Visualizing values with a Graph in Processing
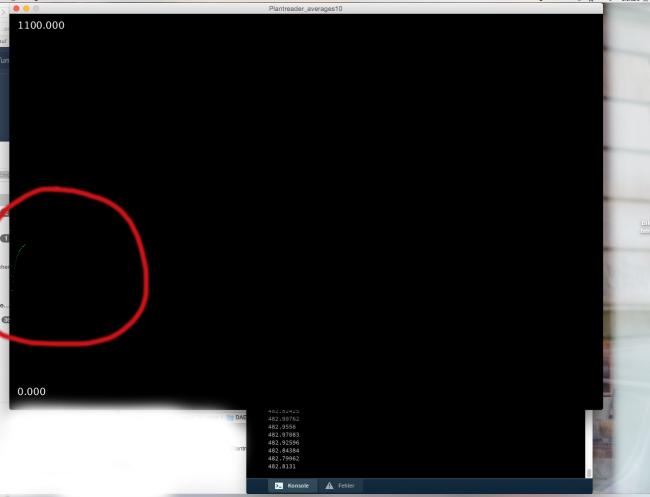
Hi ! I'm trying to measure the tiny changes of conductivity in a plant when it interacts with its surrounding. I want to visualize that with a graph in Processing. I have this code below. It tries to average the values out. Every time I want to run it, it just does there is a little bit of green line and then it stops. The is not a graph. But the values I am measuring with the Arduino are coming in without any problem.
Who can maybe help me further? Thank you :)
import processing.serial.*;
Serial myPort; // The serial port
int xPos = 1; // horizontal position of the graph
float averY = 10; // average input level
float averX = averY; // mapped averY
float mediumY = averY; // shorter average
float mediumX = 0;
float minVal = 0;
float maxVal = 1100;
int baudRate = 115200;
int avFactor = 2000;
int medFactor = 200;
int stressed;
int touched;
int relaxed;
float inByte;
int frameNr = 1;
void setup () {
size(1200, 800);
myPort = new Serial(this, Serial.list()[5], baudRate);
myPort.bufferUntil('\n');
frameRate(600);
background(0);
// show values
textSize(20);
fill(255);
text(maxVal, 10, 30);
text(minVal, 10, height-30);
}
void draw () {
// everything happens in the serialEvent()
}
void serialEvent (Serial myPort) {
// delay(50);
String inString = myPort.readStringUntil('\n');
if (inString != null) {
inString = trim(inString);
inByte = float(inString)/2;
if (inByte > 0 && inByte < 500) {
//println(" ");
//println(inByte);
// now average this out
if (frameNr < 200) {
// averY = ((avFactor - 1)*averY + inByte)/100;
// mediumY = averY;
// } else if (xPos < 1000) {
averY = ((frameNr - 1)*averY + inByte)/frameNr;
mediumY = averY;
} else {
averY = ((avFactor - 1)*averY + inByte)/avFactor;
mediumY = ((medFactor - 1)*mediumY + inByte)/medFactor;
}
// draw pure [blue]
// stroke(0, 0, 255);
// point(xPos, height - round(inByte2));
// draw average [white]
averX = map(averY, minVal, maxVal, 0, height);
stroke(255, 255, 255);
point(xPos, height - round(averX));
//println(averY);
//draw medium [green]
mediumX = map(mediumY, minVal, maxVal, 0, height);
stroke(0, 225, 0);
point(xPos, height - round(mediumX));
println(mediumY);
// draw short [red]
// shortX = map(shortY, minVal, maxVal, 0, height);
// stroke(255, 0, 0);
// point(xPos, height - round(shortX));
// check if mediumY is high
if (mediumY > 1.1*averY) { // TOUCHED!
touched++;
if (touched > 20) {
stressed = 0;
relaxed = 0;
fill(255, 0, 0, 255);
noStroke();
rect(0, 0, width, 20);
}
} else if (abs(mediumY-averY) > 0.05*averY) { // STRESSED!
stressed++;
if (stressed > 100) {
touched = 0;
relaxed = 0;
fill(0, 255, 0, 255);
noStroke();
rect(0, 0, width, 20);
}
} else {
relaxed++;
if (relaxed > 200) {
touched = 0;
stressed = 0;
fill(0, 255);
noStroke();
rect(0, 0, width, 20);
}
}
// println(stressed);
if (xPos >= width) {
// black overlay
xPos = 0;
fill(0, 80);
noStroke();
rect(0, 0, width, height);
} else {
xPos++;
}
frameNr++;
}
}
}

Tagged:


Answers
You get better attention if you properly format the code:
http://forum.processing.org/two/discussion/8045/how-to-format-code-and-text#latest
Avoid modifying the "canvas" outside the "Animation" Thread! [-X
Callback serialEvent() happens under the Serial's own Thread, btW! :-\"
Some old forums about Serial: *-:)
http://forum.Processing.org/two/discussions/tagged?Tag=bufferuntil()