Howdy, Stranger!
We are about to switch to a new forum software. Until then we have removed the registration on this forum.
Categories
- All Categories 25.7K
- Announcements & Guidelines 13
- Common Questions 30
- Using Processing 22.1K
- Programming Questions 12.2K
- Questions about Code 6.4K
- How To... 4.2K
- Hello Processing 72
- GLSL / Shaders 292
- Library Questions 4K
- Hardware, Integration & Other Languages 2.7K
- Kinect 668
- Arduino 1K
- Raspberry PI 188
- Questions about Modes 2K
- Android Mode 1.3K
- JavaScript Mode 413
- Python Mode 205
- Questions about Tools 100
- Espanol 5
- Developing Processing 548
- Create & Announce Libraries 211
- Create & Announce Modes 19
- Create & Announce Tools 29
- Summer of Code 2018 93
- Rails Girls Summer of Code 2017 3
- Summer of Code 2017 49
- Summer of Code 2016 4
- Summer of Code 2015 40
- Summer of Code 2014 22
- p5.js 1.6K
- p5.js Programming Questions 947
- p5.js Library Questions 315
- p5.js Development Questions 31
- General 1.4K
- Events & Opportunities 288
- General Discussion 365
In this Discussion
- jeremydouglass December 2017
- kfrajer December 2017
- n_renier December 2017
Add a color map to temperature values and plot them across the canvas as a continuous animation.
Hello Processing,
I'm new to processing/coding in general and am trying to figure out how to run through my data set of temperature values at 17 different longitudes for consecutive years and draw them as an animation over time.
I have loaded my .csv file as a table and created temp. variables at 17 locations. I would like to use the inferno colormap seen HERE.
** Here is the code I've been working with:**
   Table table;
   int year[];
   float t1[];
   float t2[];
   float t3[];
   float t4[];
   float t5[];
   float t6[];
   float t7[];
   float t8[];
   float t9[];
   float t10[];
   float t11[];
   float t12[];
   float t13[];
   float t14[];
   float t15[];
   float t16[];
   float t17[];

   void setup() {

   size(384,270);

     table = loadTable("MyData.csv", "header");
     year = new int[table.getRowCount()];
     t1 = new float[table.getRowCount()];
     t2 = new float[table.getRowCount()];
     t3 = new float[table.getRowCount()];
     t4 = new float[table.getRowCount()];
     t5 = new float[table.getRowCount()];
     t6 = new float[table.getRowCount()];
     t7 = new float[table.getRowCount()];
     t8 = new float[table.getRowCount()];
     t9 = new float[table.getRowCount()];
     t10 = new float[table.getRowCount()];
     t11 = new float[table.getRowCount()];
     t12 = new float[table.getRowCount()];
     t13 = new float[table.getRowCount()];
     t14 = new float[table.getRowCount()];
     t15 = new float[table.getRowCount()];
     t16 = new float[table.getRowCount()];
     t17 = new float[table.getRowCount()];
   }
   void draw() {
     background(0);

     for (int i=0; i<table.getRowCount(); i++) {
       year[i] = table.getRow(i).getInt("YEAR");
       t1[i] = table.getRow(i).getFloat("t1");
       t2[i] = table.getRow(i).getFloat("t2");
       t3[i] = table.getRow(i).getFloat("t3");
       t4[i] = table.getRow(i).getFloat("t4");
       t5[i] = table.getRow(i).getFloat("t5");
       t6[i] = table.getRow(i).getFloat("t6");
       t7[i] = table.getRow(i).getFloat("t7");
       t8[i] = table.getRow(i).getFloat("t8");
       t9[i] = table.getRow(i).getFloat("t9");
       t10[i] = table.getRow(i).getFloat("t10");
       t11[i] = table.getRow(i).getFloat("t11");
       t12[i] = table.getRow(i).getFloat("t12");
       t13[i] = table.getRow(i).getFloat("t13");
       t14[i] = table.getRow(i).getFloat("t14");
       t15[i] = table.getRow(i).getFloat("t15");
       t16[i] = table.getRow(i).getFloat("t16");
       t17[i] = table.getRow(i).getFloat("t17");
println(year[i] + ": " + t1[i] + ", " + t2[i] + ", "  + t3[i]+ "," + t4[i] + ", " + t5[i] + ", "  + t6[i]+ "," + t7[i] + ", " + t8[i] + ", "  + t9[i]+ "," + t10[i] + ", " + t11[i] + ", "  + t12[i] + "," + t13[i] + "," + t14[i] + "," + t15[i] + "," + t16[i] + "," + t17[i]) ;

 }

 }
Any help is greatly appreciated.
Tagged:

Answers
Please format your code. Edit your post (gear on top right side of any of your posts), select your code and hit
ctrl+o. Leave an empty line above and below your block of code. Details here: https://forum.processing.org/two/discussion/15473/readme-how-to-format-code-and-textKf
Thanks for the tip.
So I cheated and just indexed the temperatures in my .csv and got them to print in the right locations, but it's not running through the years like I anticipated?
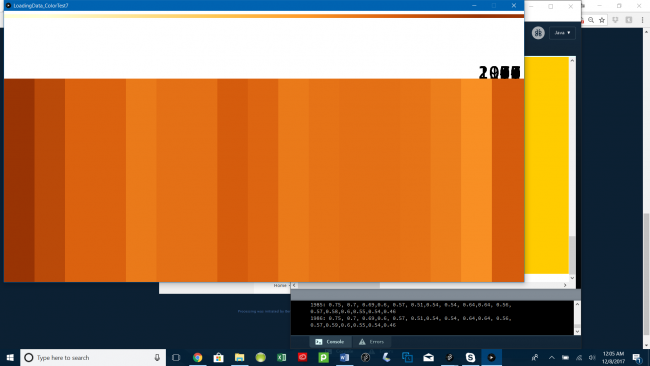
My data is printing to the console at the right speed, but the colors are not updating in my canvas. Also, the year is printing all of them at once.
Here is how I'm printing to the screen.
Please let me know what I'm doing wrong.
Cheers,
No need to run all the files at the smae time. For starters, you can work with two or three files. After you figure out the design, then you can include all your sources.
What is your ColorTable definition?
Kf
Without seeing your
ColourTableoraddContinuousColourRuleis isn't totally clear what your approach is -- although it looks like you are using linear interpolation of colors with step scaling -- although you aren't actually using the step scaling, your steps are all equidistant.The top and bottom "t1-t17" code blocks are both screaming out "I want to be in a for loop!" Those would save you ~75 lines of repetitive statements and make everything easier to read as a bonus.
Are you planning on using Viridis, or one of the others, or all of them?
I'm not sure what either of you are asking, but here is a screenshot of what is printing. I couldn't figure out how to use Viridis or any of the other maps ( I wanted to use Thermal), but I'm fine with the colors I have. I was just hoping I could export my data a movie where it shows the vertical cross section for each year one after another.
What I meant is, you shared this code:
Ok, you create an object of class ColourTable. What is a ColourTable? What does it do?
You didn't share the class code, so no idea how it works, or what advice to give you.
Ok, next you call an addContinuousColourRule() method on that class. What does that do? I can guess, but again, you didn't share that code, so I don't really know for certain.
P.S. :
It is possible that you aren't calling background() to refresh the screen each frame, so the text is piling up on top of itself without old text being erased.