Howdy, Stranger!
We are about to switch to a new forum software. Until then we have removed the registration on this forum.
Categories
- All Categories 25.7K
- Announcements & Guidelines 13
- Common Questions 30
- Using Processing 22.1K
- Programming Questions 12.2K
- Questions about Code 6.4K
- How To... 4.2K
- Hello Processing 72
- GLSL / Shaders 292
- Library Questions 4K
- Hardware, Integration & Other Languages 2.7K
- Kinect 668
- Arduino 1K
- Raspberry PI 188
- Questions about Modes 2K
- Android Mode 1.3K
- JavaScript Mode 413
- Python Mode 205
- Questions about Tools 100
- Espanol 5
- Developing Processing 548
- Create & Announce Libraries 211
- Create & Announce Modes 19
- Create & Announce Tools 29
- Summer of Code 2018 93
- Rails Girls Summer of Code 2017 3
- Summer of Code 2017 49
- Summer of Code 2016 4
- Summer of Code 2015 40
- Summer of Code 2014 22
- p5.js 1.6K
- p5.js Programming Questions 947
- p5.js Library Questions 315
- p5.js Development Questions 31
- General 1.4K
- Events & Opportunities 288
- General Discussion 365
In this Discussion
- camperos April 2014
- Nightmare_Moon April 2014
Moving Average from serialevent (Smoothing Graphs)
Background Information:
I have multiple sensors connected to my Arduino board, I am sending the signal wirelessly to my computer (via RF), I am using a processing sketch to graph out the results (I used arduino.cc/en/tutorial/Graph that graph tutorial ), and I am getting the output graphs as described in the tutorial, however they are very noisy (even though I have some hardware filters for the signal), however I believe the wires are creating more noise. I would like to do a moving average or a smoothing of the output, I was reading over in wikipedia and other sources but, even though I understand the concept I cant really convert it into code (im a beginner at programming).
Atempt at Solution
This is my Arduino Code:
=======================================================
void setup()
{
  Serial.begin(115200); //setup serial
}

void loop()
{
  // Declare variables that will store values read from each sensor
int channels[5];

  //read input pins with analog values
  channels[0] = analogRead(A0);
  channels[1] = analogRead(A1);
  channels[2] = analogRead(A2);
  channels[3]= analogRead(A3);
  channels[4] = analogRead(A4);
  //print value on the serial monitor screen
  Serial.print(channels[0]);
  Serial.print(","); Serial.print(channels[1]);
  Serial.print(","); Serial.print(channels[2]);
  Serial.print(","); Serial.print(channels[3]);
  Serial.print(",");  Serial.print(channels[4]);
  Serial.println(""); //line break
  delay(60);
}
This is the output of the Arduino code (read from the serial monitor) (NOTE I ONLY HAVE 2 SENSORS CONNECTED, SO ONLY THE FIRST 2 HAVE OSCILLATING VALUES)
=========================================================
893,751,981,943,1023
878,741,981,943,1023
866,767,981,943,1023
887,748,981,943,1023
869,736,981,943,1023
906,760,981,943,1023
876,740,981,943,1023
888,748,981,943,1023
888,749,980,943,1023
897,755,980,943,1023
858,760,980,943,1023
871,737,979,943,1023
897,754,984,940,1023
This is my Processing Sketch for the graphing of the lines (NOTE: I AM ONLY GRAPHING 2 SENSORS) NOTE: The values obtained are mostly always above 700 (they rarely drop to 600), so I am subtracting 500 from each channel just to make it fit in my 800x600 window. (IF I dont subtract the graph is near the top limit and high values might not be in the range of the graph and therefore unreadable)
=========================================================
// Graphing sketch
// This program takes ASCII-encoded strings
// from the serial port at 115200 baud and graphs them. It expects values in the
// range 0 to 1023, followed by a newline, or newline and carriage return
// Created 20 Apr 2005
// Updated 18 Jan 2008
// by Tom Igoe
// This example code is in the public domain.
import processing.serial.*;
Serial myPort; // The serial port
int xPos = 1; // horizontal position of the graph
float [] Smooth0 = new float[5];
float [] Smooth1 = new float[5];
float [] inByte = new float[5];
float [] inByte1 = new float[5];
void setup () {
// set the window size:
size(800, 600);
myPort = new Serial(this, "COM4", 115200);
// don't generate a serialEvent() unless you get a newline character:
myPort.bufferUntil('\n');
// set inital background:
background(0);
}
void draw () {
// nothing in draw, everything happens in the serialEvent()
}
void serialEvent (Serial myPort) {
// get the ASCII string:
String inString = myPort.readStringUntil('\n');
if (inString != null && inString.length() > 0) {
// trim off any whitespace:
inString = trim(inString);
String [] inputStringArr = split(inString, ","); // Convert the 5 sensors separated by a comma into individual values
// convert to an int and map to the screen height:
inByte1[0] = float(inputStringArr[0])-500; // Subtract 500 to make the graph fit in the window
inByte1[1] = float(inputStringArr[1])-500;
inByte1[2] = float(inputStringArr[2])-500;
inByte1[3] = float(inputStringArr[3])-500;
inByte1[4] = float(inputStringArr[4])-500;
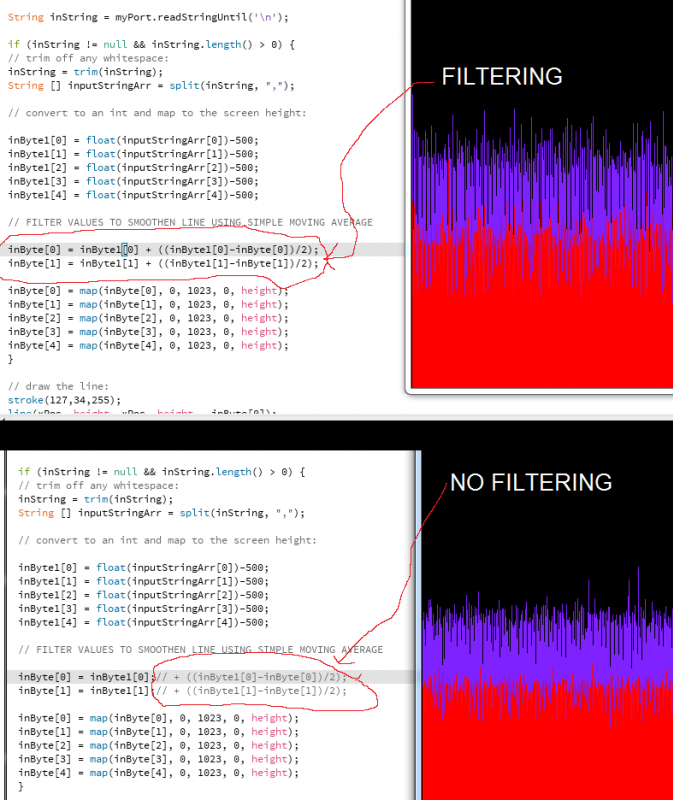
// FILTER VALUES TO SMOOTHEN LINE USING SIMPLE MOVING AVERAGE
inByte[0] = inByte1[0]; // + ((inByte1[0]-inByte[0])/2);
inByte[1] = inByte1[1]; // + ((inByte1[1]-inByte[1])/2);
inByte[0] = map(inByte[0], 0, 1023, 0, height);
inByte[1] = map(inByte[1], 0, 1023, 0, height);
inByte[2] = map(inByte[2], 0, 1023, 0, height);
inByte[3] = map(inByte[3], 0, 1023, 0, height);
inByte[4] = map(inByte[4], 0, 1023, 0, height);
}
// draw the line:
stroke(127,34,255);
line(xPos, height, xPos, height - inByte[0]);
stroke(255,0,0);
line(xPos, height, xPos, height - inByte[1]);
stroke(0,255,0);
// at the edge of the screen, go back to the beginning:
if (xPos >= width) {
xPos = 0;
background(0);
}
else {
// increment the horizontal position:
xPos++;
}
}
SO, this is what I used to "filter" values (got the equation from wikipedia):
=============================================
 inByte[0] = inByte1[0] + ((inByte1[0]-inByte[0])/2);
 inByte[1] = inByte1[1] + ((inByte1[1]-inByte[1])/2);
as you can see they are disabled in the code above, for the following reason:
=================================================
THANKS IN ADVANCE FOR READING THIS AND THANK YOU FOR YOUR HELP
Answers
edit:
Thank you for your reply, It actually smoothens the graphs a little, but I saw that the values were very low (instead of ranging in the 600-700, they were ranging below 100).
What I am thinking, is that since its a loop that repeats itself with every line read (its a serialevent), the "old values" are never really old, since the whole loop repeated itself, so basically I am taking the average of the same number, and using your code for some reason it feels like I am only outputting 5% of the data values, and it makes the spikes look smaller, and this amkes the noise look smaller.
This is my interpretation of the serial event, I might be (and hope) wrong, so please let me know:
the function void draw() AFAIK is only done once, (it can repeat itself if it has loops inside).
Serial event repeats itself for every line read. My entire repeating loop that's inside the serial event, this is what happens (according to my understanding, I hope I am wrong however):
Read line -> Assing value to inByte -> copy inByte into inByte1 -> get the average of inByte + inByte1 -> rinse, repeat.
If this is how it happens, then inByte is always equal to inByte1, and therefore it makes no sense to take an average, since they are the same all the time.
With your formula, what I get is a line every like 2 seconds, (its not continuous anymore).
sorry... doesn't work?
or 0.90---0.10 or 0.98---0.02