Howdy, Stranger!
We are about to switch to a new forum software. Until then we have removed the registration on this forum.
Categories
- All Categories 25.7K
- Announcements & Guidelines 13
- Common Questions 30
- Using Processing 22.1K
- Programming Questions 12.2K
- Questions about Code 6.4K
- How To... 4.2K
- Hello Processing 72
- GLSL / Shaders 292
- Library Questions 4K
- Hardware, Integration & Other Languages 2.7K
- Kinect 668
- Arduino 1K
- Raspberry PI 188
- Questions about Modes 2K
- Android Mode 1.3K
- JavaScript Mode 413
- Python Mode 205
- Questions about Tools 100
- Espanol 5
- Developing Processing 548
- Create & Announce Libraries 211
- Create & Announce Modes 19
- Create & Announce Tools 29
- Summer of Code 2018 93
- Rails Girls Summer of Code 2017 3
- Summer of Code 2017 49
- Summer of Code 2016 4
- Summer of Code 2015 40
- Summer of Code 2014 22
- p5.js 1.6K
- p5.js Programming Questions 947
- p5.js Library Questions 315
- p5.js Development Questions 31
- General 1.4K
- Events & Opportunities 288
- General Discussion 365
In this Discussion
- Grad_student November 2013
- hondaman900 December 2013
Data Visualization
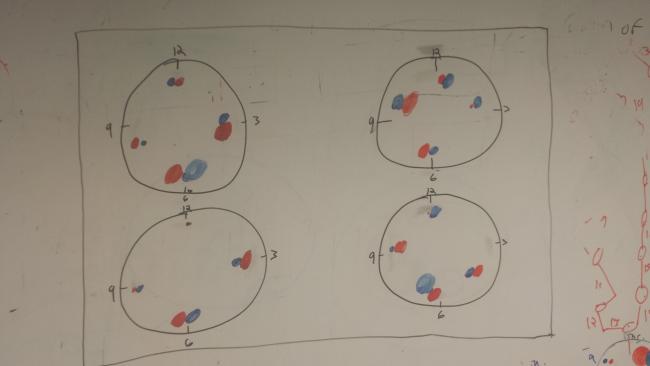
I want to create a visualization like this: 
Each black circle would represent a day. The orange and blue circles inside represent some data that I will pulling from an csv file. The varying size of the colored circles represents the numerical value of the sum of the data.
Any ideas on how to go about doing this? I guess I could just draw() a bunch of ellipses but surely there has to be a more intelligent/efficient way to do this?
Tagged:

Answers
Read the CSV file into an array. Presuming your CSV values are in a set order or identifiable as the different parameters, in your void draw() loop, assign the array values from your data points in the CSV to the correct parameters for the ellipses you're drawing. It may be a bit tedious to set up, but once you have the array values aligned with the ellipse parameters, you should be able to draw ellipses that reflect the data points.
@hondaman900
Thanks. That's what I was thinking. I guess is all about getting a handle on the area of each of the big time circles in order to get the colored circles to appear properly within it. I guess there's no way to avoid the tediousness of this task! No shortcuts.
Just a thought, but if you used an alpha transparency for the circle fills, and you're passing percentage values, you could place the data circles so that at 100% max they are still within the bounds of the containing circle. That way if the circles overlap your visualization of the data is not lost as you can still see the extent of any given circle.
That would avoid the scaling math to determine sizes of circles to make them all fit. Not knowing your project requirements I'm not sure if this is relevant to yours or not, but just a thought to share...