Howdy, Stranger!
We are about to switch to a new forum software. Until then we have removed the registration on this forum.
Categories
- All Categories 25.7K
- Announcements & Guidelines 13
- Common Questions 30
- Using Processing 22.1K
- Programming Questions 12.2K
- Questions about Code 6.4K
- How To... 4.2K
- Hello Processing 72
- GLSL / Shaders 292
- Library Questions 4K
- Hardware, Integration & Other Languages 2.7K
- Kinect 668
- Arduino 1K
- Raspberry PI 188
- Questions about Modes 2K
- Android Mode 1.3K
- JavaScript Mode 413
- Python Mode 205
- Questions about Tools 100
- Espanol 5
- Developing Processing 548
- Create & Announce Libraries 211
- Create & Announce Modes 19
- Create & Announce Tools 29
- Summer of Code 2018 93
- Rails Girls Summer of Code 2017 3
- Summer of Code 2017 49
- Summer of Code 2016 4
- Summer of Code 2015 40
- Summer of Code 2014 22
- p5.js 1.6K
- p5.js Programming Questions 947
- p5.js Library Questions 315
- p5.js Development Questions 31
- General 1.4K
- Events & Opportunities 288
- General Discussion 365
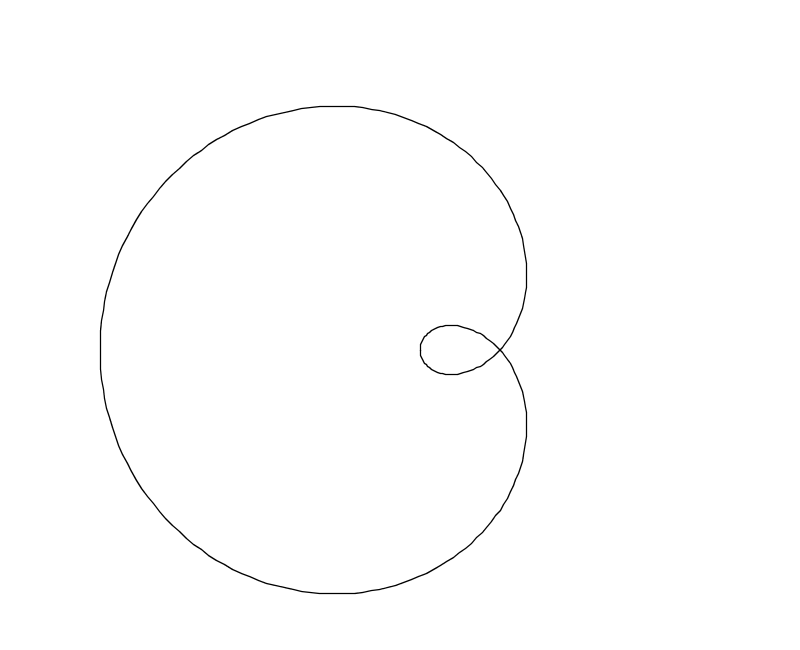
Poor quality parametric curve rendered in Processing display window
Using Processing 2.0b6 on a Windows 7 PC, I've grocked some GeoGebra code to write a sketch that plots a parametric curve (the example I've been playing with is a cardioid). It does this by generating a point distribution that is 'curvature aware'.
A horrendously messy - but working - version of the sketch is here, and a stripped down version that includes an array of points belonging to the cardioid but not the curve-plotting algorithm that generated it is here.
The problem is the way in which the curve is rendered as a polyline in the Processing display window when each of the points in the point distribution is connected. This image shows how hairy and lumpy the rendering is, but... and this is the nub of the issue... check out this beautifully smooth pdf rendering.
What's going on here? The (almost) flawless vector graphic makes me confident that the problem isn't the point distribution but rather something to do with the to-pixel rendering for the display window (I know my terminology is imprecise here). Is the shifting and scaling affecting things? Is the to-pdf converter doing something fancy with the point distribution?
I'm puzzled. Any help / insights would be massively appreciated.
By the way, if anyone's interested, I've also coded up the cardioid in Java (again, the code is messy but functional):
and openframeworks:
with resulting pdf: